
Fig 5
- ID
- ZDB-IMAGE-220131-220
- Publication
- Lu et al., 2021 - Delta/Jagged-mediated Notch signaling induces the differentiation of agr2-positive epidermal mucous cells in zebrafish embryos
- All Figures
- Figures for Lu et al., 2021
|
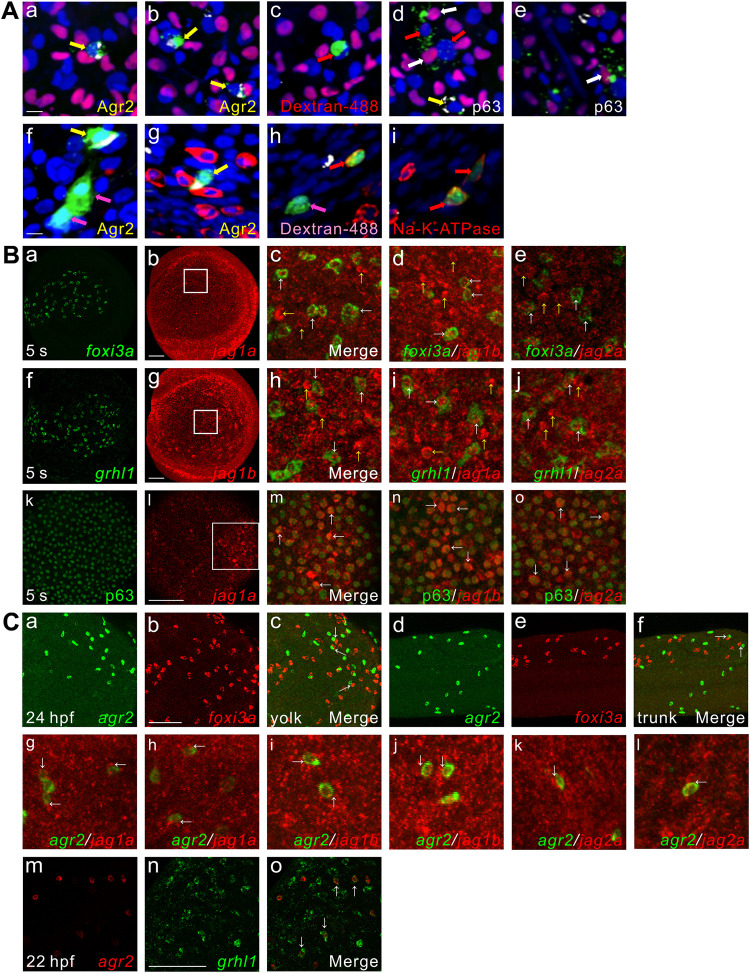
Fig 5 agr2+ EMCs and keratinocytes or ionocytes are derived from common ectodermal precursors, coexpression of jag1a/jag1b/jag2a with foxi3a, grhl1 or p63, agr2 is expressed next to foxi3a or jag1a/ jag1b/jag2a and coexpression of agr2 and grhl1.
(A). agr2+ EMCs and keratinocytes or ionocytes are derived from common ectodermal precursors. Yellow arrows (a, b, d, f, g) indicate Agr2+ and dextran+ (dextran-488) cells. White arrows (d, e) indicate P63+ and dextran+ cells. Red arrows (c, d) and pink arrows (f, h) indicate only dextran+ cells. Red arrows (h, i) indicate Na+-K+-ATPase+ and dextran+ cells. Scale bars, 10 μm. (B). Coexpression of jag1a/jag1b/jag2a with foxi3a, grhl1 or p63 detected at 5 s. White square boxes indicate enlarged area. White arrows indicate examples of colocalized cells. Yellow arrows indicate example of jag1a-, jag1b- or jag2a-expressing cells. Images (k-o) were derived from 3 to 4 Z-stacks. (C). Some foxi3a+ cells locate next to agr2+ EMCs in the trunks and yolks of embryos at 24 hpf. Some jag1a-, jag1b- or jag2a-expressing cells were located next to agr2+ EMCs in the epidermis of embryos at 22 hpf. Coexpression of grhl1 and agr2 was observed in embryos at 22 hpf. White arrows (c, f, g-l) indicate examples of agr2+ EMCs located adjacent to foxi3a+ or jag1a-, jag1b- or jag2a-expressing cells. White arrows (o) indicate examples of colocalized cells. Scale bars, 100 μm. Underlying data are available in S1 Data.