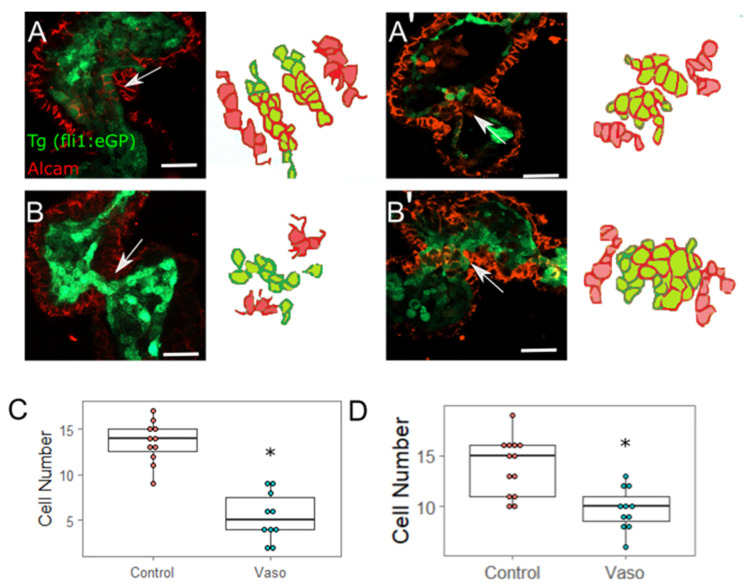
Figure 6 Increased myocardial afterload causes aberrant AVJ cell specification. (A) Control hearts stained with ALCAM at 56 hpf. (A’) Control hearts stained with ALCAM at 72 hpf. Scale bar represents 20µm. (B,B’) Representative image of vaso-treated heart at (B) 56 hpf and at (B’) 72 hpf. (C) Number of ALCAM expressing endocardial cells. N = 11 wildtype hearts, 10 vaso treated hearts at 56 hpf. Statistical significance was determined using Student’s t-test; * indicates p < 0.05. (C,D) Number of ALCAM expressing endocardial cells. N = 11 wildtype hearts, 10 vaso-treated hearts at 72 hpf. Five cells were analyzed per location per heart, area was measured for each cell and averaged. AVJ myocardial cells were defined as myocardial cells located in the constriction between the atrium and ventricle.
Image
Figure Caption
Acknowledgments
This image is the copyrighted work of the attributed author or publisher, and
ZFIN has permission only to display this image to its users.
Additional permissions should be obtained from the applicable author or publisher of the image.
Full text @ J Cardiovasc Dev Dis

