
Image
|
Figure Caption
FIGURE 4
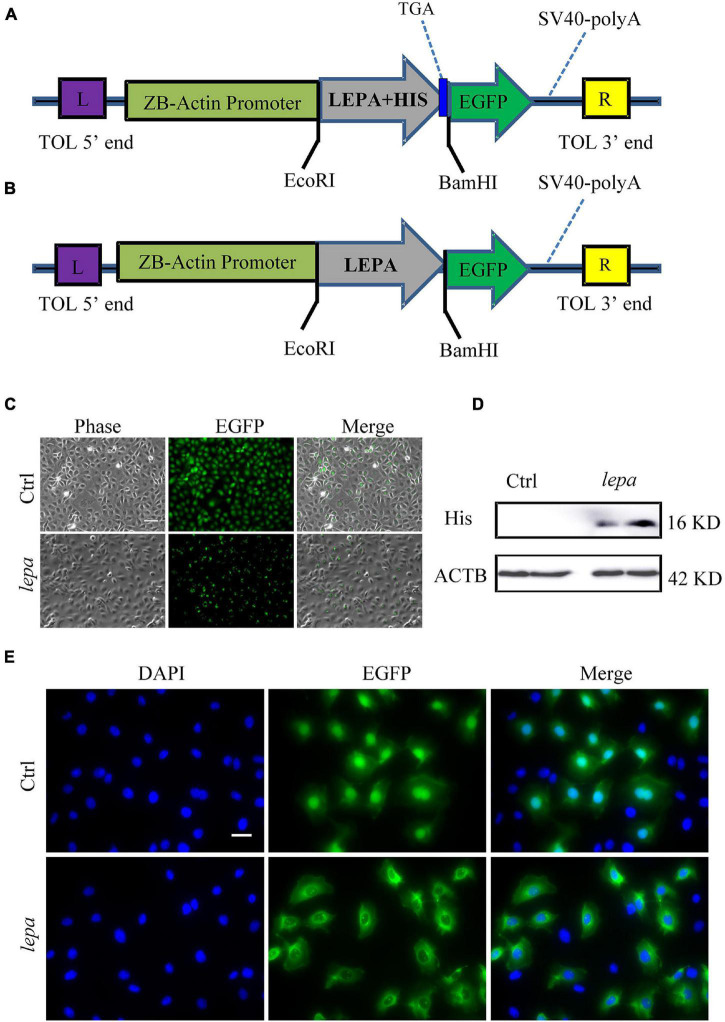
Over-expression of DM-lepa in ZFL cells. (A,B) DM-Lepa expression vector map. (C) Fluorescence observation after transfection of ZFL cells with empty plasmid and DM-lepa gene eukaryotic expression plasmid. Scale bar, 50 μm. (D) Western blot analysis of DM-LEPA in ZFL. (E) Assay of subcellular localization in ZFL cells. Green fluorescence show signal of DM-LEPA and blue nuclei stained with DAPI. Scale bar, 20 μm.
Acknowledgments
This image is the copyrighted work of the attributed author or publisher, and
ZFIN has permission only to display this image to its users.
Additional permissions should be obtained from the applicable author or publisher of the image.
Full text @ Front. Physiol.