
|
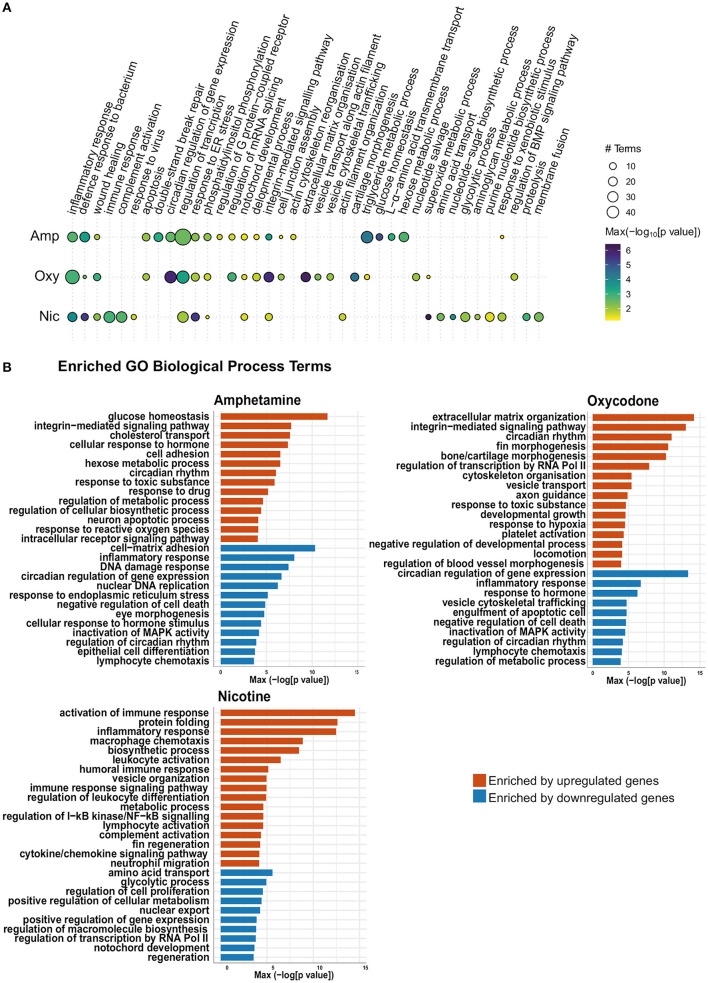
Figure 5
Gene Ontology (GO) term enrichment analysis shows enrichment of both common and distinct biological process terms across treatments. (A) Bubble plot of the GO BP enrichment results across the three drug treatments. Individual enriched BP terms were aggregated to a parent term. For example, regulation of circadian rhythm (GO:0042752), circadian rhythm (GO:0007623) and circadian behavior (GO:0048512) are all aggregated to the parent term circadian regulation of gene expression. The size of each circle represents the number of individual terms enriched for each parent term and they are colored by the smallest of the p-values (–log10 scale). (B) Bar charts showing top 40 upregulated terms and top 40 downregulated terms (by p-value) for each drug treatment. Individual enriched BP terms were aggregated to a representative term and colored by the smallest of the p-values (–log10 scale) as in (A).