
Figure 5
- ID
- ZDB-IMAGE-220131-134
- Antibodies
- Publication
- Bu et al., 2021 - Inhibition of mTOR or MAPK ameliorates vmhcl/myh7 cardiomyopathy in zebrafish
- All Figures
- Figures for Bu et al., 2021
|
Figure 5
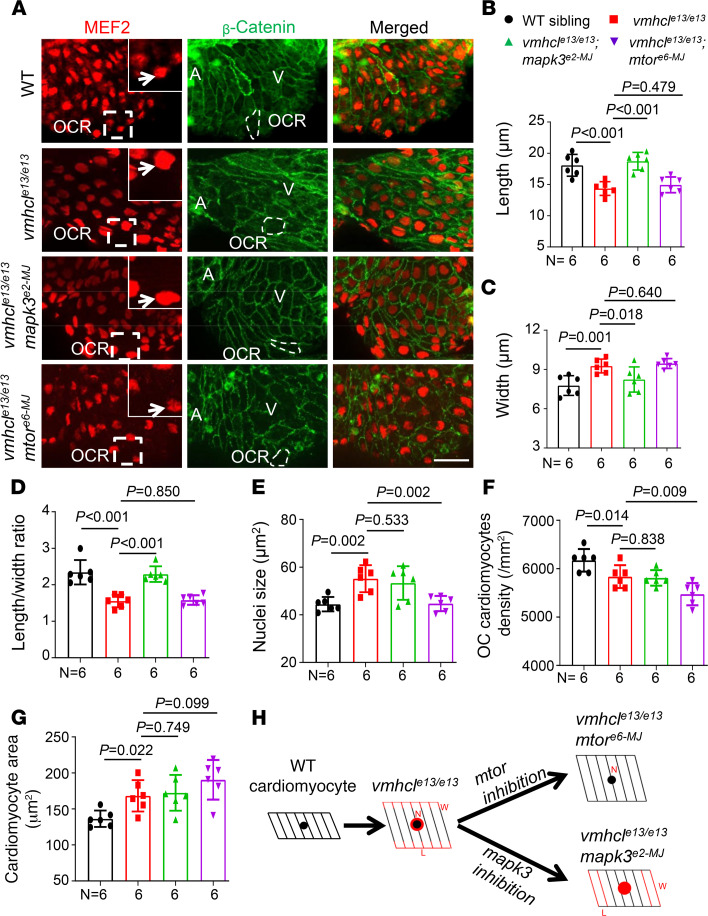
(A) Representative images of the nucleus and outline of cardiomyocytes were obtained by immunostaining with anti–myocyte enhancer factor-2 (red) and anti–β-catenin (green) antibodies in WT controls and vmhcle13/e13, vmhcle13/e13mapk3e2-MJ, and vmhcle13/e13mtore6-MJ mutants at 3 dpf. The insets show the boxed areas at higher original magnification. The white arrows indicate nuclei of the cardiomyocytes. Representative cardiomyocytes in the OCR are outlined by dashed white lines in panels with β-catenin staining. A, atrium; V, ventricle; scale bar: 25 μm. (B–G) Quantification of the cardiomyocyte length (B), cardiomyocyte width (C), cardiomyocyte length/width ratio (D), cardiomyocyte nuclei size (E), cardiomyocyte density (F), and cardiomyocyte area (G) measured in these mutants and WT controls. n = 6; data are presented as the mean ± SD; 1-way ANOVA. (H) Schematics of different cellular changes observed upon mapk3 and mtor inhibition in the VEC model. Red indicates changes in cardiomyocyte length (L), width (W), or nuclei size (N).