
|
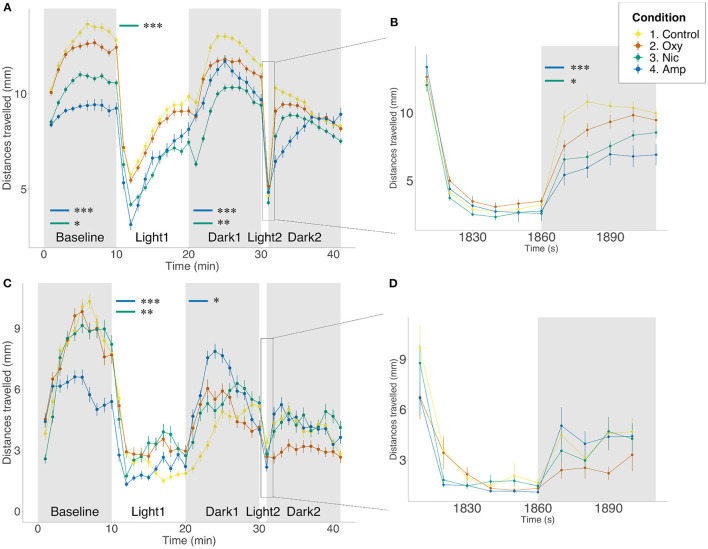
Figure 1
Differences in locomotion in FLD assay. Mean distance traveled per minute by larvae from each treatment group during alternating dark (gray) and light (white) periods. Startle response following 1 min light exposure is displayed in a 10-s resolution plot (B,D). (A,B) Light/dark-induced locomotor responses in 5 dpf larvae in the presence of drug. Sample size n = 96 for each group. (C,D) Light/dark-induced locomotor responses in 6 dpf larvae in the absence of drug. Sample size n = 48 for each group. Significant differences are indicated where present: for locomotion during dark periods (minute 0–10 and 20–30); for slope of recovery in light periods (minute 10–20) and for startle response following 1 min light exposure (B,D). Data shows mean ± SEM. Data was fitted to the linear mixed effect model and post-hoc Tukey test was used to identify multiple correlations (*p < 0.05, **p < 0.01, ***p < 0.001 Tukey's multiple comparison test).