IMAGE

Fig 3

ID
ZDB-IMAGE-220131-10
Source
Figures for Reddy et al., 2022
Image
Figure Caption

Fig 3 Analysis of larval zebrafish behaviour exploring neutral and aversive environments.

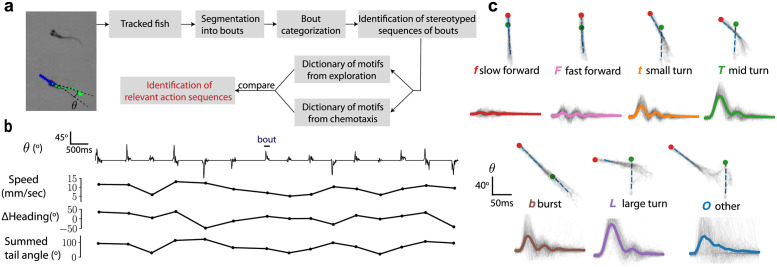
(a) Overview of the analysis pipeline. (b) A time series of the tail angle θ shows the discrete nature of locomotor episodes (‘bouts’) with the corresponding speed, change in heading and the summed tail angle calculated as the summed absolute amplitude of the tail angle. (c) Samples of the seven bout types identified using a Gaussian Mixture Model. In the superimposed images corresponding to a given bout type, the green and red dots correspond to the head position at the bout beginning and end respectively. Below each sample, the average tail angle θ is shown in solid color with 200 trajectories shown in grey.

Acknowledgments
This image is the copyrighted work of the attributed author or publisher, and ZFIN has permission only to display this image to its users. Additional permissions should be obtained from the applicable author or publisher of the image. Full text @ PLoS Comput. Biol.