
Fig. 6
- ID
- ZDB-IMAGE-220107-6
- Publication
- Graves et al., 2021 - Zebrafish harbor diverse intestinal macrophage populations including a subset intimately associated with enteric neural processes
- All Figures
- Figures for Graves et al., 2021
|
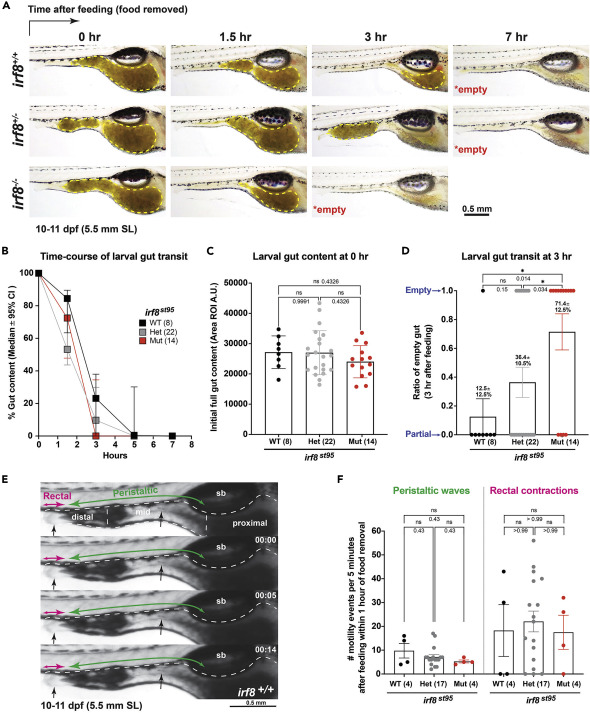
Fig. 6 (A) Longitudinal analysis of intestinal transit in rotifer-fed larval zebrafish at 10-11 dpf (5.5 mm SL) indicates faster emptying of gut contents in irf8 mutants, most by 3 hours (hr) after feeding and food withdrawal compared with 5-7 hr for control wild-type and heterozygous siblings. Color images of the gut, where food content is clearly visible (yellow dotted region), were taken at the specified time points for each individual tracked in real time. By 7 hr post feeding, all larvae were found to have empty guts. (B) Time course plot showing median percentage of gut content and the 95% confidence interval (CI) for larval gut transit at 10-11 dpf. Most irf8 mutants reach 0% gut content by 3 hr post feeding compared with siblings at 5-7 hr postfeeding. (C) Initial level of gut content indicates no significant difference in food intake in the different genotypes. Error bars show S.D. (D) Analysis of the ratio or percentage of individual larvae with empty intestines at 3 hr postfeeding shows that irf8 mutants have a significantly larger proportion at 71.4% compared with wild-type (12.5%) and heterozygous (36.4%) siblings. No significant difference was found between wild-type and heterozygotes.Error bars show S.E.M. (E) Static monochromatic images extracted from a video recording of wild-type larval zebrafish gut motility. See also Videos S1, S2, and S3 for a representative recording of each genotype. Annotations show swim bladder (sb); three main gut divisions (dotted regions): proximal for the intestinal bulb, midgut, and distal gut; and two major modes of motility (rectal contractions and peristaltic waves, both anterograde (mouth to anus) and retrograde (regurgitation) directions). Larger arrows indicate the predominant direction of the gut movement. Black arrows, sites of major gut movements. Timestamp in minutes: seconds. Scale bars shown as indicated. (F) Scattered bar chart shows no significant difference in number of peristaltic waves and rectal contractions, although irf8 mutants have a trend, although not significant, of reduced peristalsis. ns, not significant. Statistical significance was determined using one-way ANOVA test followed by multiple comparisons. Error bars show S.E.M. Each data point in plots C, D, and F represents an individual animal.