
Fig. 3
- ID
- ZDB-IMAGE-220107-3
- Publication
- Graves et al., 2021 - Zebrafish harbor diverse intestinal macrophage populations including a subset intimately associated with enteric neural processes
- All Figures
- Figures for Graves et al., 2021
|
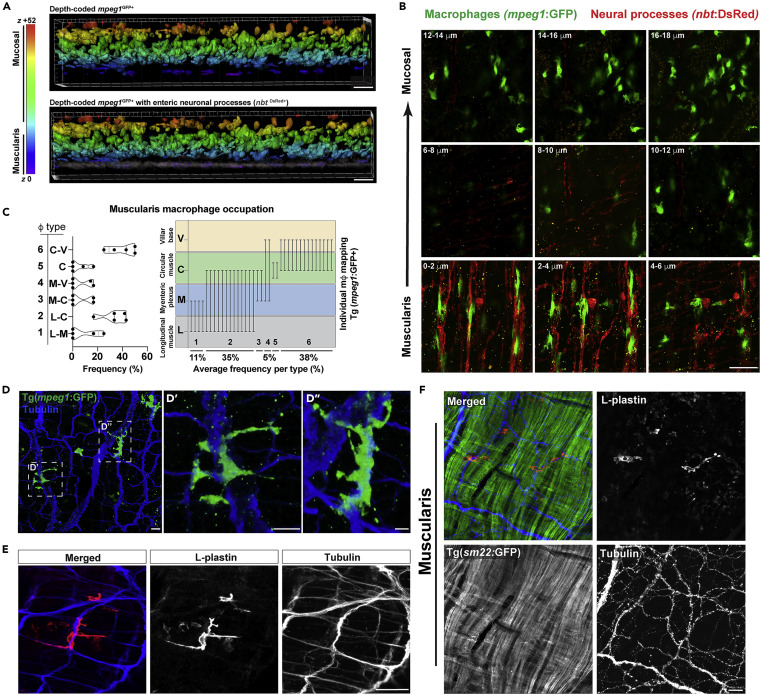
Fig. 3 (A) Volumetric depth-coded analysis (Imaris) of 40 x confocal micrographs from Tg(mpeg1:GFP;nbt:dsRed) ex vivo proximal adult gut highlighting a spatially distinct mpeg1GFP+ MMφ population (purple, top panel) which co-segregate with dense nbtDsReD+ neural processes (gray, bottom panel). Data are representative of at least n = 5 animals. (B) 2 μm confocal z series micrographs (0.5 μm voxel depth with Nyquist sampling) showing intimate mpeg1GFP+ MMφ - nbtDsRed+neural process associations. (C–E) (C, left) Graphical representations of MMφ occupation frequencies spanning the longitudinal muscle – myenteric plexus (L-M), longitudinal muscle – circular muscle (L-C), myenteric plexus – circular muscle (M-C), myenteric plexus – villar ridge base (M-V), circular muscle (C), or circular muscle – villar ridge base (C-V) regions. (C, right) Graphical representations of end-to-end macrophage occupation across gut layers highlighting bridging MMφ phenotype. High-resolution confocal imaging with Nyquist sampling of ex vivo (D) Tg(mpeg1:GFP) adult gut tissue (α- GFP, α-acetylated tubulin immunolabeled) highlight neural bridging of mpeg1GFP+ MMφ processes and (E) wild-type adult gut tissue without Tg (α- L-plastin and α-acetelated tubulin immunolabeled) demonstrating Tg-independent visualization of MMφ-neural processes and interactions. (F) Ex vivo Tg(sm22:GFP) adult gut tissue was fixed and sm22:GFP, L-plastin, and acetylated tubulin were visualized by antibody-mediated immunolabeling to highlight specific MMφ associations with neural processes rather than smooth muscle fibers of the muscularis externa. Scale bars shown = 20 μm (A, F); 50 μm (B, E); 40 μm (D).