
|
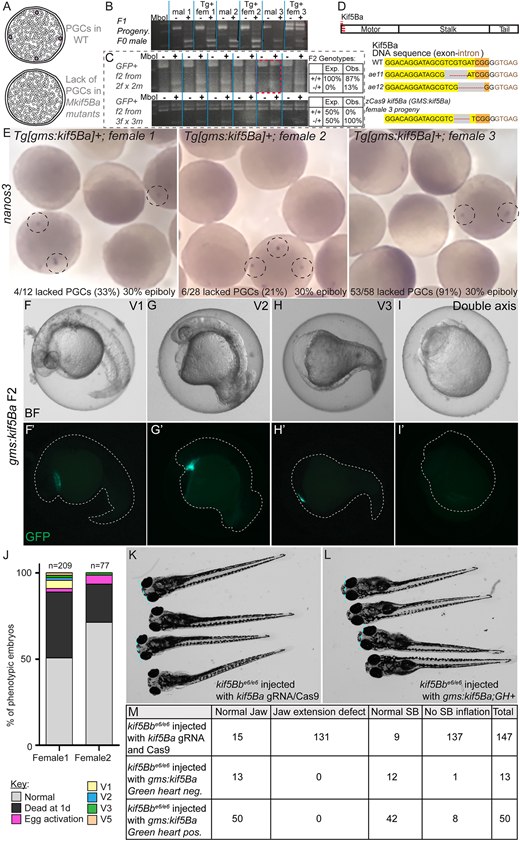
Fig. 3 (A) Schematic of expected (and observed) wild-type and Mkif5ba PGC phenotypes. (B,C) Representative restriction enzyme-based assay for kif5ba mutations in (B) F1 and (C) F2 progeny of transgenic adults. Chart in C shows the expected and observed mutation frequencies for each cross. Plus indicates MboI digested; minus indicates undigested. #×# indicates the individuals intercrossed from F1 fish shown in B. (D) Schematic of Kif5Ba protein, the targeted region and representative mutant sequences. (E) nanos3 staining of embryos from three independent clutches of F1 GMS:kif5ba mothers. Black dashed circles highlight PGCs, all others shown lack germ cells (see also Fig. S4). GMS:kif5ba F2. (F,F′) V1 ventralized embryo. (G,G′) V2 ventralized embryo. (H,H′) V3 ventralized embryo. (I,I′) V5 ventralized embryo. (J) Quantification of ventralization classes. (K) Representative kif5bbe6/e6 larvae injected with kif5ba guide RNA and Cas9 (‘crispants’) at d5. (L) Representative kif5bbe6/e6 larvae injected with GMS:kif5ba at d5. (K,L) Dashed blue lines are at the level of the eyes. Jaw extension defects are present in ‘crispants’ (K), whereas the jaws of GMS:kif5ba transgenic larvae are normal (L). (M) Quantification of jaw and swim bladder (SB) phenotypes.