Fig. 1.
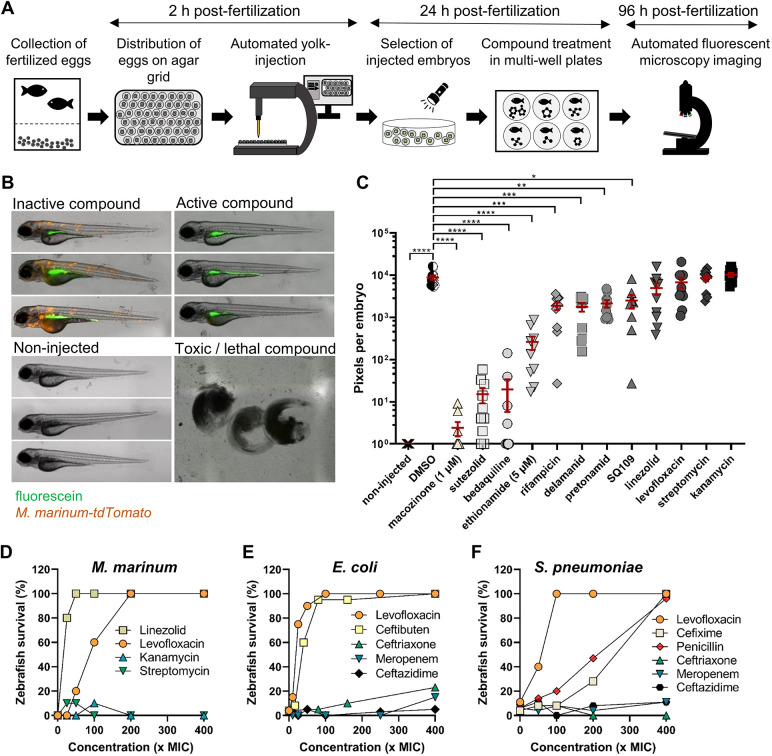
A zebrafish embryo infection model can be used for medium-throughput compound screening and can predict the oral bioavailability of test compounds. (A) Schematic representation of the in vivo drug-screening setup in the zebrafish-M. marinum infection model. (B) Representative images of different readout groups of M. marinum-infected zebrafish embryos. (C) M. marinum-tdTomato yolk-infected zebrafish embryos treated with antibiotics at 10 µM, or as specified. Each data point represents the integrated red fluorescence intensity of a single zebrafish embryo, and the signal of each group (10-12 embryos) is expressed as mean±s.e.m. Statistical significance was determined by one-way ANOVA, following Dunnett's multiple comparison test by comparing the signal from the DMSO-treated control sample with each treatment group (*P≤0.05, **P≤0.01, ***P≤0.001, ****P≤0.0001). (D) Zebrafish embryos were yolk infected with M. marinum-tdTomato and at 24 hpi treated by adding the antibiotics into the fish water. Survival was scored 4 dpi. Each group consisted of ten embryos. A non-treated group of embryos (0×MIC) served as control. (E,F) Zebrafish were infected via the caudal vein route with E. coli GK1161434 (E) or S. pneumonia D39V (F) and treated by the addition of the antibiotics to the fish water at 1 hpi. Survival was scored 24 hpt. Each group consisted of 20-40 embryos. Concentrations of all antibiotics were based on the MIC value of the antibiotic for each strain (see Table S1). A non-treated group of embryos (0×MIC) served as control.

