
Figure 2
- ID
- ZDB-IMAGE-220104-160
- Publication
- Taranta et al., 2021 - Benefits and Toxicity of Disulfiram in Preclinical Models of Nephropathic Cystinosis
- All Figures
- Figures for Taranta et al., 2021
|
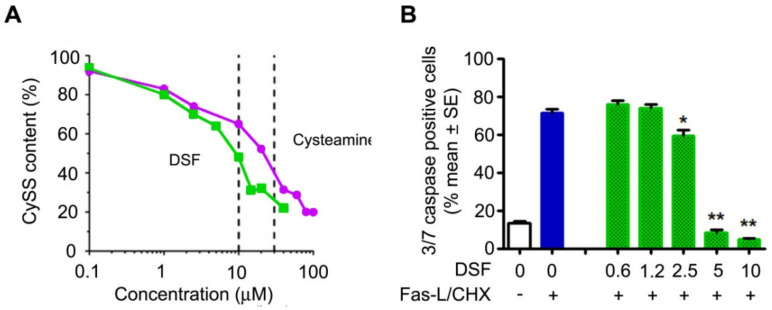
Figure 2 Cystine-depleting and anti-apoptotic proprieties of DSF. (A) Comparison of dose–response curves. Cystine (CySS) accumulation was measured after treatment for 24 h with the indicated concentrations of DSF and cysteamine in cystinotic ciPTECs. Vertical dashed lines indicate IC50 for DSF (9 µM) and cysteamine (22 µM). Data represent 4 independent experiments. (B) Anti-apoptotic dose response of DSF. The white and blue columns indicate spontaneous or induced apoptosis with Fas-Ligand (Fas-L) and cycloheximide (CHX) in cystinotic ciPTECs, respectively. The green columns indicate the treatment with DSF (0.6–10 µM) in cells exposed to apoptotic stimuli. Data represent 3 independent experiments. * p < 0.005 and ** p < 0.0005 vs. blue column.