
Image
|
Figure Caption
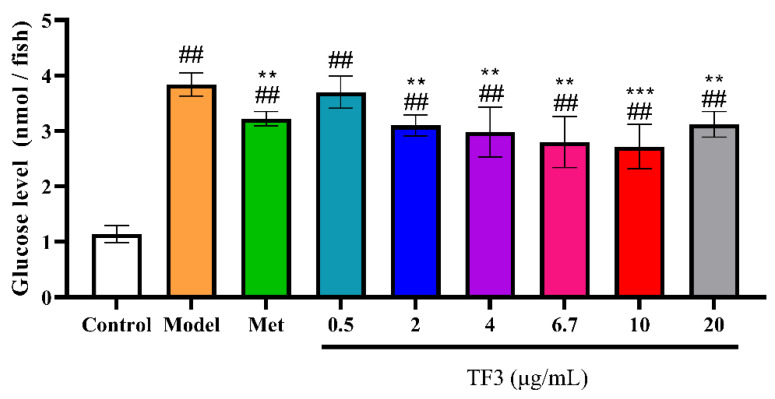
Figure 3 TF3 treatment reduced glucose level in zebrafish. Results were expressed as the mean ± SD (n = 5). Control, water culture; model, water with 1 μM alloxan and 4% glucose culture for 24 h; TF3, water with different concentrations of TF3 (0.5, 2, 4, 6.7, 10, and 20 μg/mL) treating for 24 h after alloxan-treatment; Met, water with metformin hydrochloride (10 μg/mL) treating for 24 h after alloxan-treatment. ## p < 0.01 versus control group. ** p < 0.01 versus model group, *** p < 0.001 versus Model group.
Acknowledgments
This image is the copyrighted work of the attributed author or publisher, and
ZFIN has permission only to display this image to its users.
Additional permissions should be obtained from the applicable author or publisher of the image.
Full text @ Nutrients