
Image
|
Figure Caption
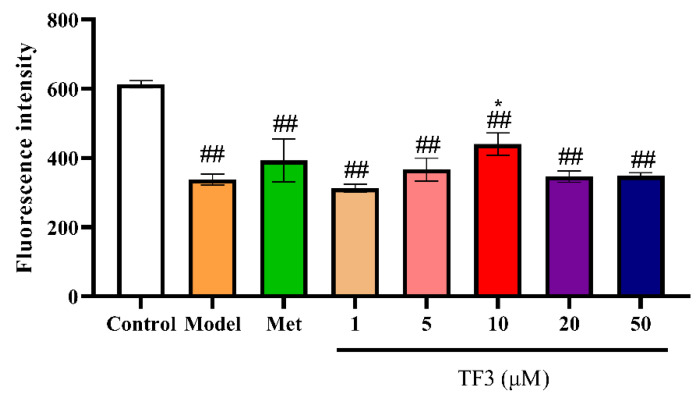
Figure 2 TF3 treatment recovered glucose uptake in glucose-treated insulin resistance HepG2 cells. Control, DMEM medium culture; model, DMEM medium with 500 μM glucose treating for 24 h; TF3, DMEM medium containing different concentrations of TF3 (1, 5, 10, 20, 50 μM) treating for 24 h after glucose-treatment; Met, DMEM medium containing metformin hydrochloride (10 μM) treating for 24 h after glucose-treatment. * p < 0.05 versus model group., ## p < 0.01 versus control group.
Acknowledgments
This image is the copyrighted work of the attributed author or publisher, and
ZFIN has permission only to display this image to its users.
Additional permissions should be obtained from the applicable author or publisher of the image.
Full text @ Nutrients