
Image
|
Figure Caption
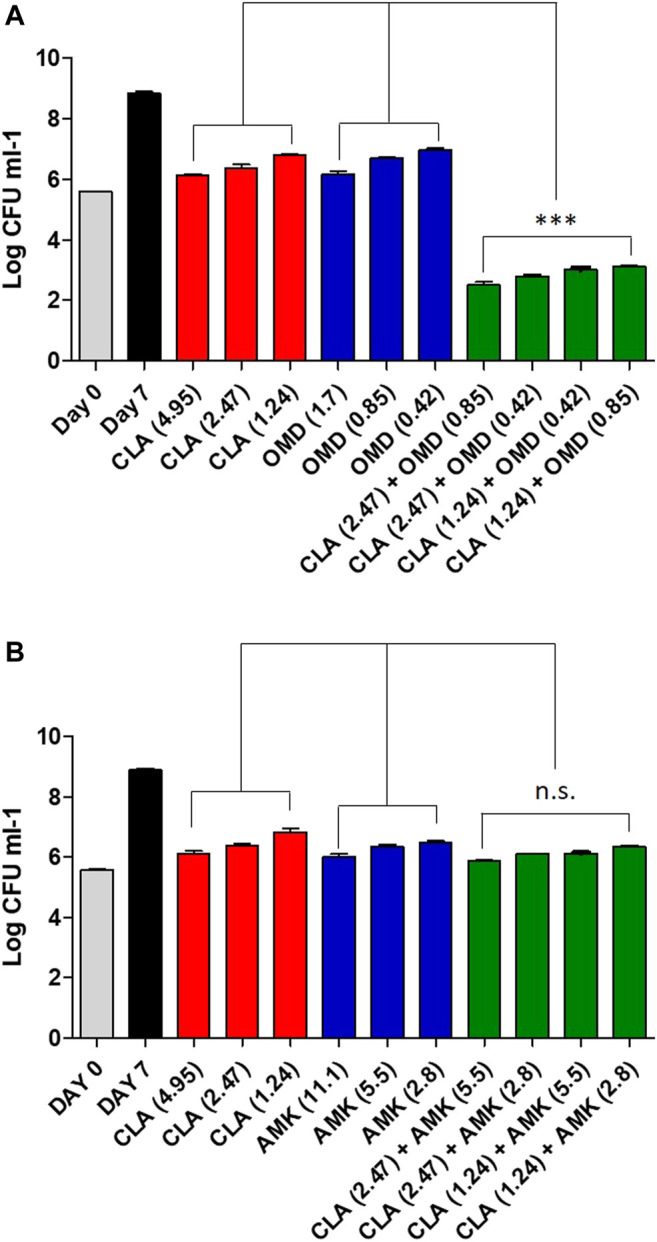
FIGURE 2
Estimation of bactericidal effect by CFU counts. Mab was grown in the presence of different concentrations of CLA alone or in combination with decreasing concentrations of OMD (A) and AMK (B). Following 7 days of culture, Mab were plated to 7H10 agar plate to determine live bacteria. The DMSO treated bacteria were also plated on day 0 and on day 7. One-way ANOVA with Tukey’s multiple comparison test was used to compare the means across multiple groups (**p < 0.01; ***p < 0.001).
Acknowledgments
This image is the copyrighted work of the attributed author or publisher, and
ZFIN has permission only to display this image to its users.
Additional permissions should be obtained from the applicable author or publisher of the image.
Full text @ Front Pharmacol