
Fig. 3
- ID
- ZDB-IMAGE-211230-95
- Publication
- Arias-Alpizar et al., 2021 - Stabilin-1 is required for the endothelial clearance of small anionic nanoparticles
- All Figures
- Figures for Arias-Alpizar et al., 2021
|
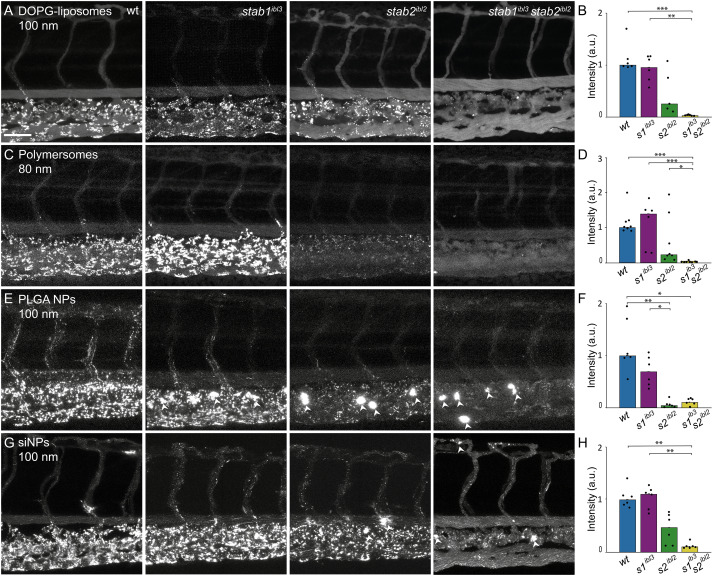
Fig. 3 Combined contribution of Stabilin-1 and Stabilin-2 in the clearance of anionic NPs. (A-B) Tissue level view (40×) and quantification of fluorescently labeled DOPG-liposomes, (C-D) polymersomes, (E-F) PLGA NPs, (G-H) siNPs after i.v. injection (1 nL) in wt (AB/TL), stab1ibl3, stab2ibl2 single and stab1ibl3stab2ibl2 double mutants at 1-1.5 h post injection (hpi). White arrows indicate apparent NP uptake within plasma-exposed macrophages. Scale bar: 50 μm. Graphs represent intensity of fluorescent NPs in wt and stab mutants. Bar height represents median values, dots are individual data points, and brackets indicate significant values (*P ˂ 0.05, **P ˂ 0.01, ***P ˂ 0.001) based on Kruskal–Wallis tests followed by two-tailed Dunn’s tests with Bonferroni correction.
Reprinted from Nanomedicine : nanotechnology, biology, and medicine, 34, Arias-Alpizar, G., Koch, B., Hamelmann, N.M., Neustrup, M.A., Paulusse, J.M.J., Jiskoot, W., Kros, A., Bussmann, J., Stabilin-1 is required for the endothelial clearance of small anionic nanoparticles, 102395, Copyright (2021) with permission from Elsevier. Full text @ Nanomedicine