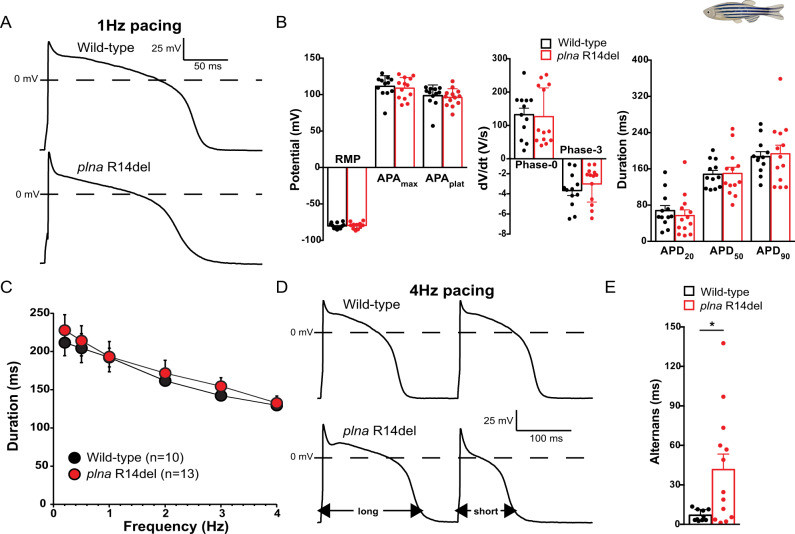
Fig. 4 A Typical action potentials (APs) of cardiomyocytes isolated from a 10-month-old wild type (WT) (top panel) and plna R14del mutant (bottom panel) zebrafish, paced at 1 Hz. B Average AP parameters at 1 Hz pacing (mean ± SEM, WT n = 12, plna R14del n = 13, unpaired Students t-test). C AP duration at 90% of repolarization (APD90) at 0.2–4 Hz pacing (mean ± SEM, WT n = 10, plna R14del n = 13, unpaired Students t-test). D Two consecutive APs during 4 Hz pacing in a WT (top panel) and plna R14del (bottom panel) cardiomyocyte. The plna R14del cardiomyocyte showed an AP alternans where a long AP is followed by a short AP. E Average APD90 difference between two consecutive APs (alternans) during 4 Hz pacing (mean ± SEM, *p = 0.044, WT n = 10, plna R14del n = 13, Mann–Whitney rank-sum test). Wild type are highlighted in black and plna R14del in red. WT wild type, Hz Hertz, mV millivolt, ms milliseconds, V/s Volts per second, RMP resting membrane potential, APAmax maximal action potential amplitude, APAplat action potential amplitude at plateau phase, APD20 AP duration at 20% of repolarization, APD50 AP duration at 50% of repolarization, APD90 AP duration at 90% of repolarization. Source data are provided as a Source Data file.
Image
Figure Caption
Acknowledgments
This image is the copyrighted work of the attributed author or publisher, and
ZFIN has permission only to display this image to its users.
Additional permissions should be obtained from the applicable author or publisher of the image.
Full text @ Nat. Commun.

