
|
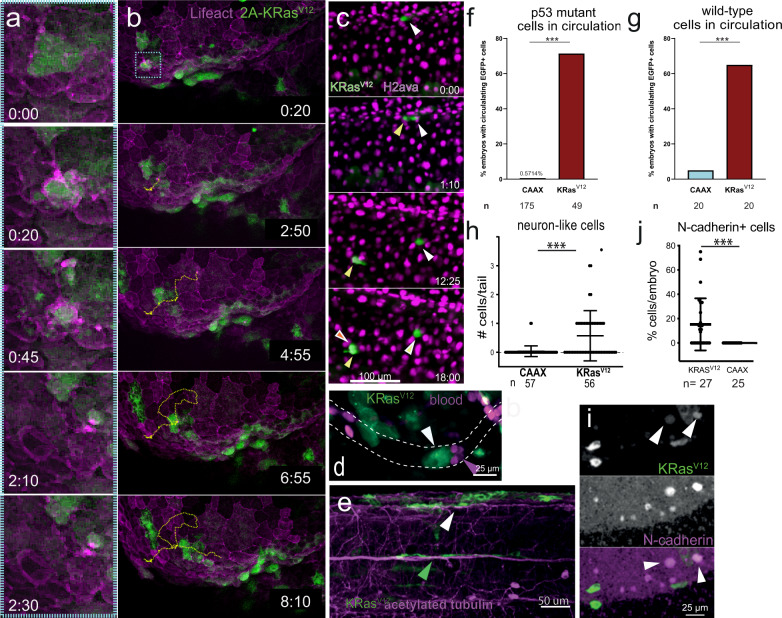
Fig. 3
b Stills from Supplementary Movie 8 of a basally extruding EGFP-T2A-KRasV12 cell from a periderm:Lifeact-mCherry reporter line, where (a) is a zoom inset (blue) for only the first 2.5 hrs, showing BCE and migration, tracked with dashed yellow line. c Stills from Supplementary Movie 11 of an invaded EGFP-KRasV12 cell dividing in a h2afva:h2afva-mCherry reporter line, where white, yellow, and red arrowheads indicate daughter cells from the two cell divisions. d Stills from Supplementary Movie 14 showing an EGFP-KRasV12 cell blocking flow of gata1:mCherry-labelled blood cells. In all cases, movies were from 24-48 hpf with (hh:mm). Percentage of CAAX or T2A-KRasV12 embryos with circulating EGFP+ cells in p53mut (f) and wild-type (g) zebrafish as mean + SEM, ***P < 0.001 by a Fisher Exact test, n = embryos. e T2A-KRasV12 cells with neuron-like morphology, with white arrowhead indicating co-staining with acetylated tubulin and green arrowhead aligning along a neuron. h Neuron-like EGFP-CAAX or T2A-KRasV12 cells per n embryos (beneath), ***P < 0.001 by a Mann–Whitney test. i N-cadherin immunostaining indicating some dt-KRasV12 (arrowheads) adopt this mesenchymal marker. j Percentage of invaded cells that are N-cadherin+ per embryo, as mean ± SEM, where ***P < 0.001 by a Mann–Whitney test. All graphs were from embryos fixed at 48 hpf. Source data are provided as a Source Data file.