
FIGURE 4
- ID
- ZDB-IMAGE-211230-31
- Publication
- Hageter et al., 2021 - Environmental and Molecular Modulation of Motor Individuality in Larval Zebrafish
- All Figures
- Figures for Hageter et al., 2021
|
FIGURE 4
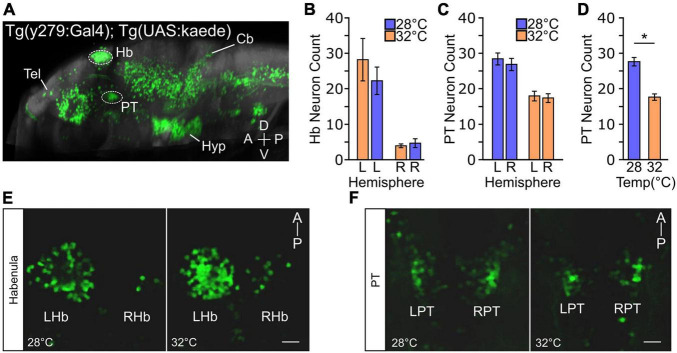
Temperature impacts y279 specified expression in the PT. (A) Single sagittal slice of larval zebrafish brain showing expression of enhancer trap Tg(y279:Gal4) obtained from the ‘Zebrafish Brain Browser’ atlas. Circled regions highlight the habenula (Hb) and rostral posterior tuberculum (PT) and white lines show the telencephalon (Tel), hypothalamus (Hyp), and cerebellum (Cb). (B–F) Effect of elevated temperature during early development on the expression of y279 in the habenula and PT. (B) Expression of y279 in the left and right hemisphere Hb nuclei (28°C purple, N = 16; 32°C orange, N = 14). (C) y279 positive PT neurons (28°C purple, N = 16; 32°C orange, N = 14). (D) Combined left and right hemisphere PT neuron counts (28°C purple, N = 16; 32°C orange, N = 14). (E,F) Representative images showing maximum intensity projections for y279 positive Hb (left habenula, LHb; right habenula, RHb) (E) and PT (left PT, LPT; right PT, RPT) (F) neurons for larvae raised at 28 or 32°C. Scale bar 20 μm. Asterisk p < 0.05.