
|
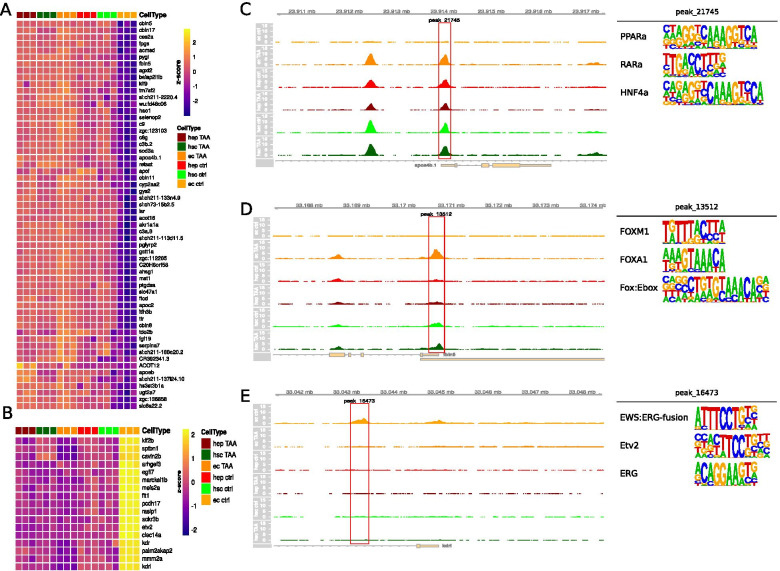
Fig. 6 Cell type specific accessibility changes in response to TAA treatment in selected cell types and clusters. a Heatmap of selected genes in each cell type. Genes were selected based on accessibility patterns in cluster B; b Heatmap of selected genes in each cell type. Genes were selected based on accessibility patterns in cluster B; c Genomic browser snapshot at apoa4b.1 promoter localization with accessibility track expressed as reads per million. Highlighted peak was used as a selection criteria in a., its three most enriched motifs are shown next to the browser track; d Genomic browser snapshot at fbln5 promoter localization with accessibility track expressed as reads per million. Highlighted peak was used as a selection criteria in a., its three most enriched motifs are shown next to the browser track; e Genomic browser snapshot at kdrl promoter localization with accessibility track expressed as reads per million. Highlighted peak was used as a selection criteria in b., its three most enriched motifs are shown next to the browser track