
|
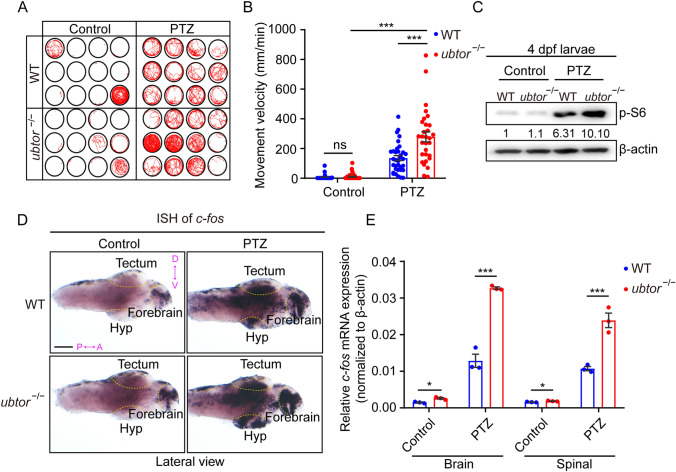
Fig. 6
ubtor mutants exhibit hypersensitivity to PTZ. A, B Locomotion tracks A and movement velocity B of 4-dpf larvae treated with water (solvent) (three biological repeats, NWT = Nubtor−/− = 36, t128 = 0.737) or 3 mmol/L PTZ (three biological repeats, NWT = Nubtor−/− = 36, t128 = 4.753) in a 10-min period. C Immunoblotting for p-S6 protein in 4-dpf larvae treated with water or PTZ. Values of p-S6 protein levels are indicated. D Expression and distribution of c-fos mRNA in brain tissue of 4-dpf larvae treated with solvent (water) or PTZ (scale bar, 100 μm). E RT-qPCR analysis of c-fos mRNA levels in brain and spinal tissues of 4-dpf larvae treated with control or PTZ (three biological repeats, control: NWT = Nubtor−/− = 75; 3 mmol/L PTZ:NWT = Nubtor−/− = 75). β-actin served as the internal control. Values are represented as the mean ± SEM in B and E. *P <0.05, ***P <0.001.