
|
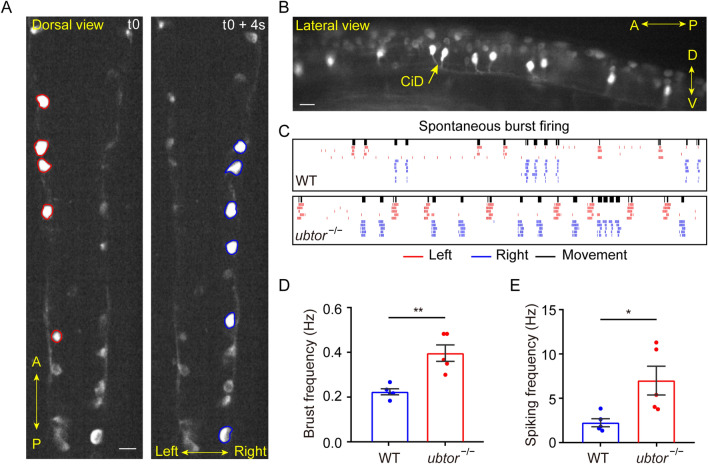
Fig. 3
Calcium imaging of spinal interneurons. A Representative Ca2+ signals of spinal cord interneurons. At t0 (an arbitrary time point in the video sequence), interneurons on the left side are firing, followed by interneurons on the right side 4 s later (dorsal view; scale bar, 40 μm). B Firing interneurons are CiD interneurons; the Ca2+ signal lights up the soma and the descending axons of CiD interneurons during a burst (lateral view, scale bar, 40 μm). C Rasters of correlated muscle movements and neuronal bursts (black bars, muscle movements; red and blue lines, left and right interneuron spikes estimated by the MLspike method). D, E Quantitative analysis of neuronal burst frequency (NWT = Nubtor−/− = 5, t8 = 4.396; D and spike frequency (NWT = Nubtor−/− = 5, t8 = 2.821; E of spinal interneurons. Values are represented as the mean ± SEM in D and E. *P <0.05, **P <0.01.