
|
Figure 1
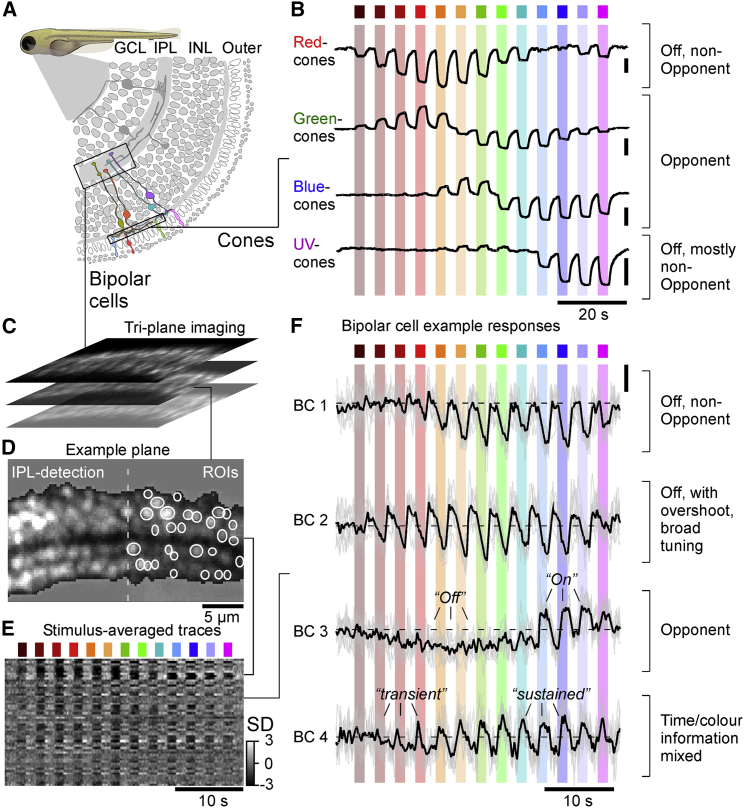
Measuring high-spectral resolution tuning curves in zebrafish bipolar cells
(A) Schematic of the larval zebrafish retina, with cone terminals in the outer retina and bipolar cell (BC) terminals in the inner retina highlighted.
(B) Mean calcium responses of red-, green-, blue-, and UV-cone terminals to a series of 13 spectrally distinct widefield flashes of light as indicated (data from Yoshimatsu et al.
(C–F) Illustration of recording strategy for BC terminals in the inner plexiform layer (IPL) and exemplary results. An optical triplane approach (C, top) was used to simultaneously record from three planes of larval zebrafish BC terminals expressing SyjGCaMP7b by way of two-photon imaging coupled with remote focusing (
Zebrafish larva schematic (A) by Lizzy Griffith. See also