
Image
|
Figure Caption
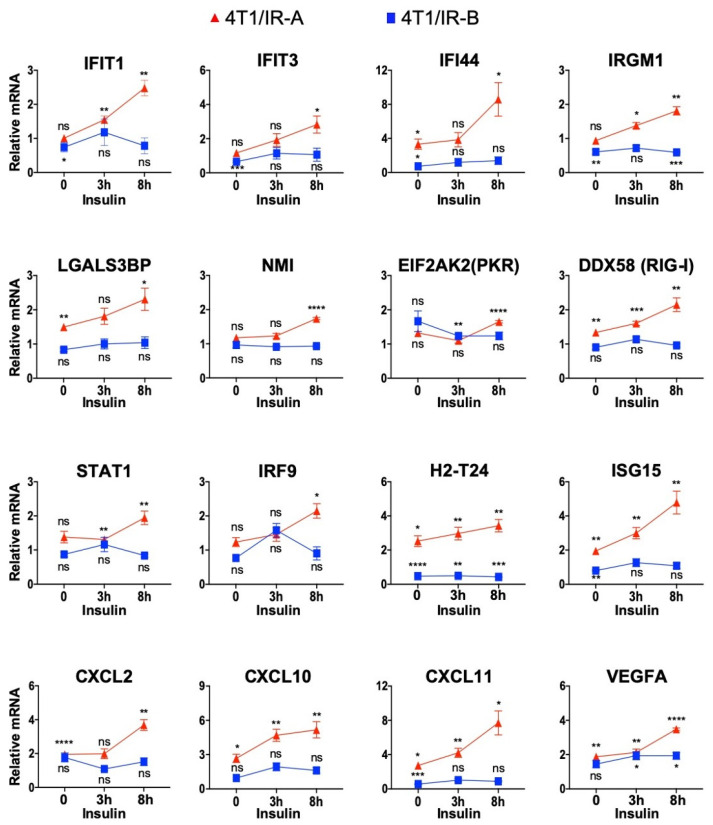
Figure 6
RNA-Seq transcriptome profiling validation through qRT-PCR analysis of selected genes. Data were normalized over the corresponding values obtained from control cells and are expressed as means ± SE from three different experiments. (ns, not significant; p > 0.05; * p < 0.05; ** p < 0.01; *** p < 0.001; and **** p < 0.0001).
Acknowledgments
This image is the copyrighted work of the attributed author or publisher, and
ZFIN has permission only to display this image to its users.
Additional permissions should be obtained from the applicable author or publisher of the image.
Full text @ Cells