
|
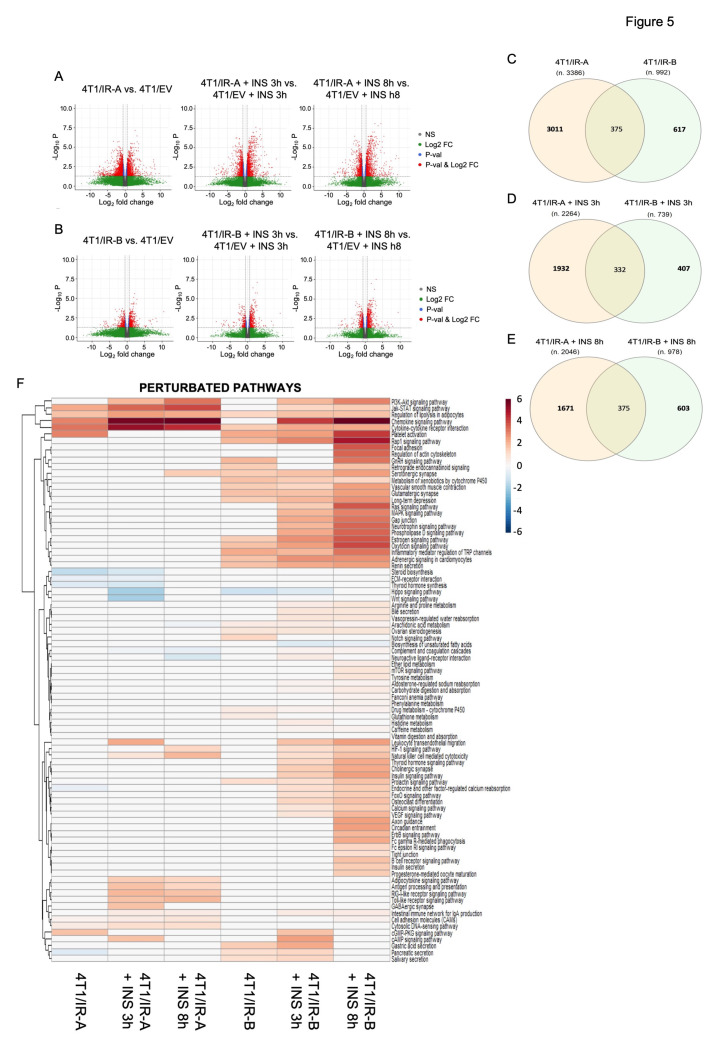
Figure 5
RNA-Seq transcriptome profiling. (A) Volcano plots show differentially expressed transcripts (in red) found with the following comparison IR-A vs. EV, IR-A_INS_3 h vs. EV_INS_3 h, and IR-A_INS_8 h vs. EV_INS_8 h. (B) Volcano plots show the differentially expressed transcripts (in red) with the following comparison IR-B vs. EV, IR-B_INS_3 h vs. EV_INS_3 h, and IR-B_INS_8 h vs. EV_INS_8 h. (C) Overlaps of the differentially expressed transcripts between 4T1/IR-A and 4T1/IR-B without insulin treatment. (D) Overlaps of the differentially expressed transcripts between 4T1/IR-A and 4T1/IR-B after insulin treatment for 3 h. (E) Overlaps of the differentially expressed transcripts between 4T1/IR-A and 4T1/IR-B after insulin treatment for 8 h. (F) Heatmap of the dysregulated pathways. This heatmap shows dysregulated pathways found by MITHrIL using the results of the RNA-Seq data analysis. Pathways were colored accordingly to their corrected accumulator values calculated by the MITHrIL algorithm. The red color means upregulation while the blue color means path downregulation. Pathways that were not found to be statistically dysregulated are colored in white.