
|
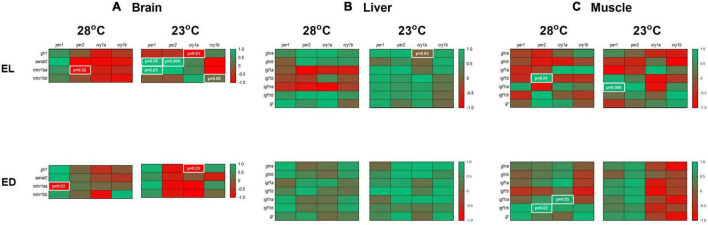
FIGURE 8
Correlation of gene expression in the brain, liver and muscle of adult Danio rerio. (A) Brain. Four positive and four negative correlations; (B) liver. One positive correlation; (C) muscle. Four positive correlations. Data from the same sample, temperature and time point with a Gaussian distribution were analyzed by Pearson correlation coefficients. The values are expressed as coefficient r. Values: 1 perfect correlation; 0 to 0.99 the two variables tend to increase or decrease together; 0 the two variables do not vary together at all; 0 to –0.99 one variable increases as the other decreases and –1 as perfect negative or inverse correlation. Significance was set for p < 0.05, shown in white letters inside white boxes.