
Figure 1
- ID
- ZDB-IMAGE-211216-144
- Publication
- Lu et al., 2021 - A Novel Germline Heterozygous BCL11B Variant Causing Severe Atopic Disease and Immune Dysregulation
|
Figure 1
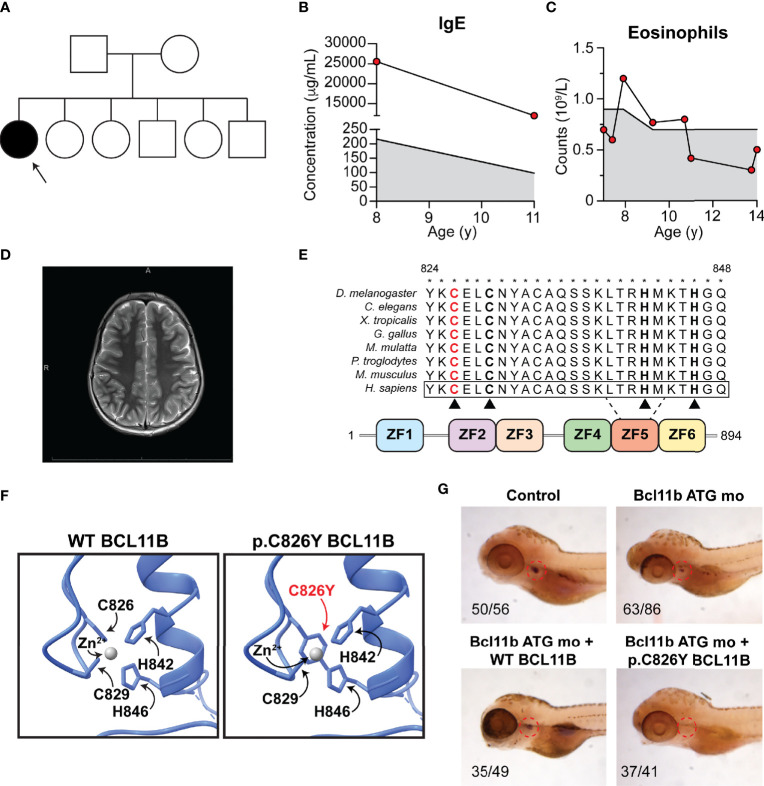
Patient phenotype and functional validation of a novel BCL11B variant. (A) Family pedigree. Arrow, proband. (B) Patient IgE at ages 8 and 11. (C) Patient eosinophil counts from ages 7 to 14. (B, C) Shaded region, reference range. (D) Patient brain magnetic resonance imaging. (E) Schematic of BCL11B protein. Red, substitution location. Asterisks, conservation. Black triangles, zinc coordinating residues. ZF, zinc finger. (F) Homology-based modeling of affected region. (G) Rescue of T-cell development visualized by lck probe post-bcl11ba knockdown with Bcl11b ATG mo and heat-inducible reexpression of WT (bottom left) or p.Cys826Tyr BCL11B (bottom right). Indicated are the number of individuals with observed phenotype.