
IMAGE
Fig. 7
- ID
- ZDB-IMAGE-211213-7
- Publication
- Zhu et al., 2021 - Rcl1 depletion impairs 18S pre-rRNA processing at the A1-site and up-regulates a cohort of ribosome biogenesis genes in zebrafish
- All Figures
- Figures for Zhu et al., 2021
Image
|
Figure Caption
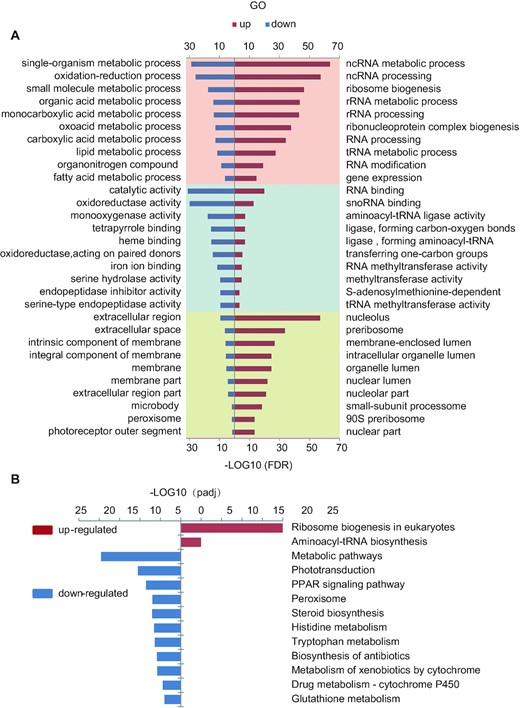
Fig. 7 GO and KEGG enrichment analysis of the DEGs reveled an up-regulation of a cohort of genes related to ribosome biogenesis. (A) Top 10 significantly enrichment GO analysis for up-regulated (right panel, red bar) and down-regulate (left panel, blue bar) DEGs in BP, MF and CC items. BP: biological process (pink panel, top); MF: molecular function (light blue panel, middle); CC: cellular component (yellow panel, bottom). (B) Significantly enriched KEGG pathway for up-regulated (right panel, red bar) and down-regulate (left panel, blue bar) DEGs.
Acknowledgments
This image is the copyrighted work of the attributed author or publisher, and
ZFIN has permission only to display this image to its users.
Additional permissions should be obtained from the applicable author or publisher of the image.
Full text @ Nucleic Acids Res.