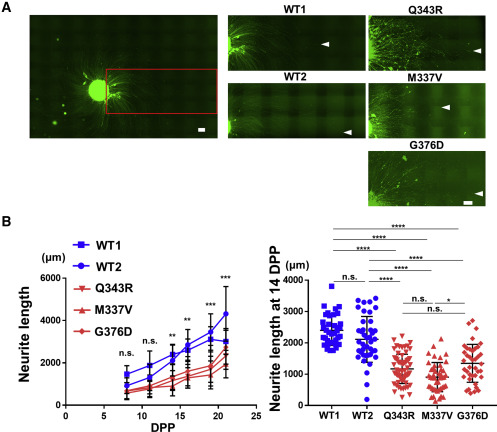
Fig. 2 (A) Neurite lengths of iPSC-derived TARDBP mutant MNs were compared with those of healthy control MNs during culture. MNs were infected with EF-1α::Venus lentivirus vector, formed spheres, and then examined periodically under fluorescence microscopy. The white arrowheads indicate the most distal end of each neurite. Neurite lengths were compared among two healthy control MN populations derived from two separate iPSC lines (WT1 and WT2) (left) and TARDBP mutants (Q343R, M337V, and G376D) (right). Scale bar, 300 μm. (B) Changes in MN neurite length over time. Twenty to 74 neurites were analyzed per group for one experiment, depending on the time post differentiation. A comparison between the healthy control and TARDBP mutant groups showed that the neurite length significantly decreased in the TARDBP mutant group from day 14 (left graph). Statistical comparison at 14 dpp among cell lines also confirmed that TARDBP mutant MNs had significantly shorter neurites than had healthy control MNs (right graph). Repeated measures ANOVA with post hoc Tukey HSD tests for comparison between healthy control and TARDBP mutant groups. Two-way ANOVA with post hoc Tukey HSD tests for among each cell lines. ∗∗p < 0.01, ∗∗∗∗p < 0.0001
Image
Figure Caption
Acknowledgments
This image is the copyrighted work of the attributed author or publisher, and
ZFIN has permission only to display this image to its users.
Additional permissions should be obtained from the applicable author or publisher of the image.
Full text @ Stem Cell Reports

