
|
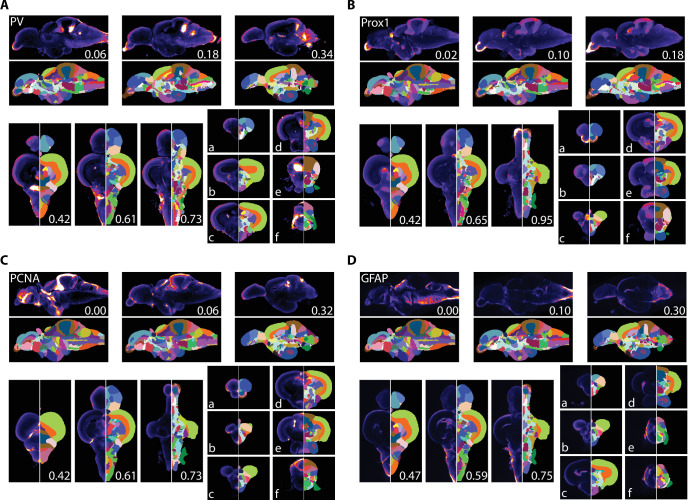
Figure 7.
For sagittal (top) and horizontal (left, bottom), numbers represent distance (in mm) from midline or top of the brain, respectively. Slices for each plane were chosen based on the presence of staining (see Results for description).
Averaged and registered antibody stains with corresponding segmentation for (A) PV, (B) Prox1, (C) PCNA, and (D) GFAP where hotter colors indicate greater staining.