IMAGE

Fig. 3

ID
ZDB-IMAGE-211207-48
Source
Figures for Davis et al., 2021
Image
Figure Caption

Fig. 3

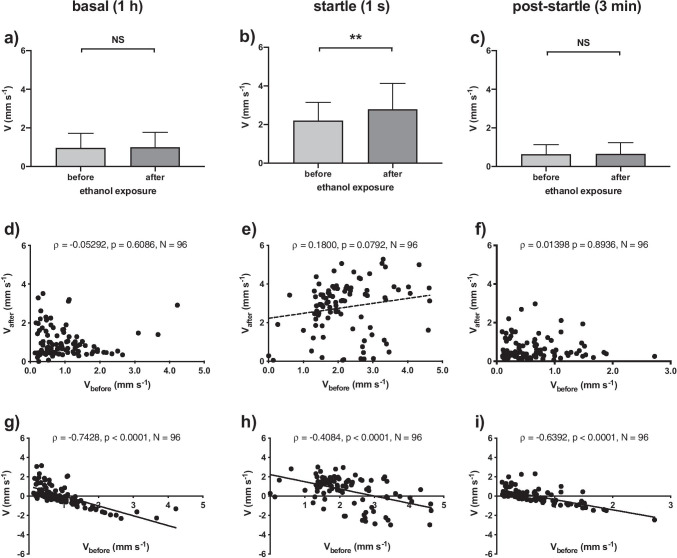
Results of the ethanol test. Swimming velocity (V, mm s−1) of zebrafish larvae at 6 dpf, before and after exposure to a non-lethal 1% ethanol solution in egg water. We depicted basal, startle, and post-startle phase data, respectively. ac When considering the entire population, swimming velocity was significantly different between pre-exposure and exposure conditions only during the startle phase (b; Wilcoxon paired-signed rank test; ** p < 0.01, NS p > 0.05, N = 96), but not during basal (a) and post-startle phase (c). df There were no significant correlations between individual velocities in pre-exposure and exposure conditions for any of the phases (Spearman rank test). A dotted line indicates a non-significant trend (0.05 < p < 0.1). The consistency of inter-individual variation across days, as found in the first test, was not found within an hour in the context of ethanol exposure in this second test. gi Activity level dependent individual variation in response yielded a significantly negative correlation between V and ΔV in all three of the phases (Spearman rank test). A line indicates a significant correlation (p < 0.05)

Acknowledgments
This image is the copyrighted work of the attributed author or publisher, and ZFIN has permission only to display this image to its users. Additional permissions should be obtained from the applicable author or publisher of the image. Full text @ Psychpharma