
Fig 2
- ID
- ZDB-IMAGE-211207-24
- Publication
- Marsay et al., 2021 - Tetraspanin Cd9b and Cxcl12a/Cxcr4b have a synergistic effect on the control of collective cell migration
- All Figures
- Figures for Marsay et al., 2021
|
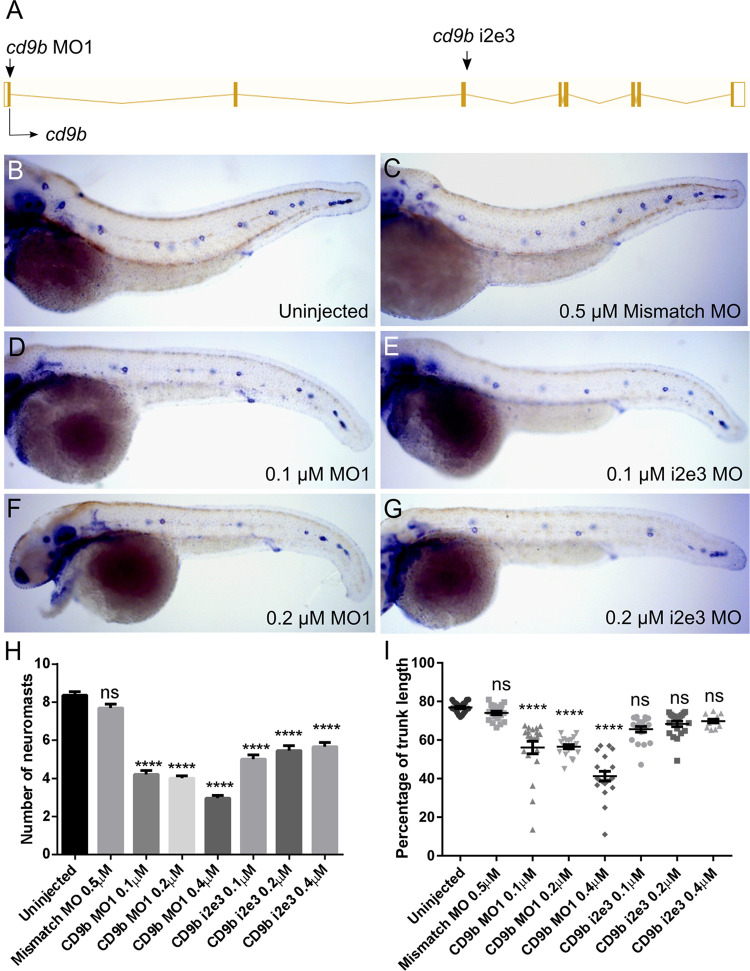
Fig 2
A: Intron exon diagram of the cd9b gene with MO target sites. B-G: Representative images of WISH of claudin b at 52 hpf of (b) uninjected embryos, (c) embryos with 0.5 μM Mismatch, (d) 0.1 μM cd9b MO1, (e) 0.1 μM cd9b i2e3 MO1, (f) 0.2 μM cd9b MO1, (g) 0.2 μM cd9b i2e3 MO. H: Graph showing the number of neuromasts deposited at 52 hpf is significantly decreased after injection with both cd9b MO1 and cd9b i2e3 MO, with as low as 0.1 μM MO. I: Graph showing the percentage of trunk between the first and last deposited neuromast is decreased in cd9b MO1 morphants but not cd9b i2e3 morphants. ANOVA with Dunnett’s multiple comparisons test was used. n = minimum 12 lateral lines analysed per condition. ****p = <0.05.