
IMAGE
Fig 1
- ID
- ZDB-IMAGE-211207-23
- Genes
- Publication
- Marsay et al., 2021 - Tetraspanin Cd9b and Cxcl12a/Cxcr4b have a synergistic effect on the control of collective cell migration
- All Figures
- Figures for Marsay et al., 2021
Image
|
Figure Caption
Fig 1
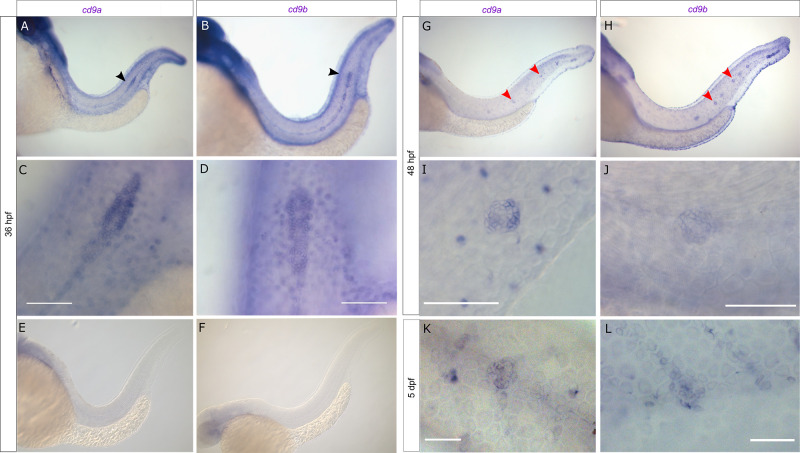
cd9a and cd9b are expressed in the pLLP during zebrafish development.
A-F: Micrographs of WISH of cd9a and cd9b at 36 hpf with sense and anti-sense probes. (a-b) Overview shows staining in pLL; (c-d) higher resolution images show expression in the primordium; (e-f) sense probes show no staining. G-J: WISH of cd9a and cd9b at 48 hpf; (g-h) overview shows staining in pLL; (i-j) higher resolution images show expression in a neuromast. K-L: WISH of cd9a and cd9b at 5 dpf in a neuromast. Arrows indicate primordium (black) and neuromasts (red). Scale bar indicates 50 μm (white).
Figure Data
Acknowledgments
This image is the copyrighted work of the attributed author or publisher, and
ZFIN has permission only to display this image to its users.
Additional permissions should be obtained from the applicable author or publisher of the image.
Full text @ PLoS One