
|
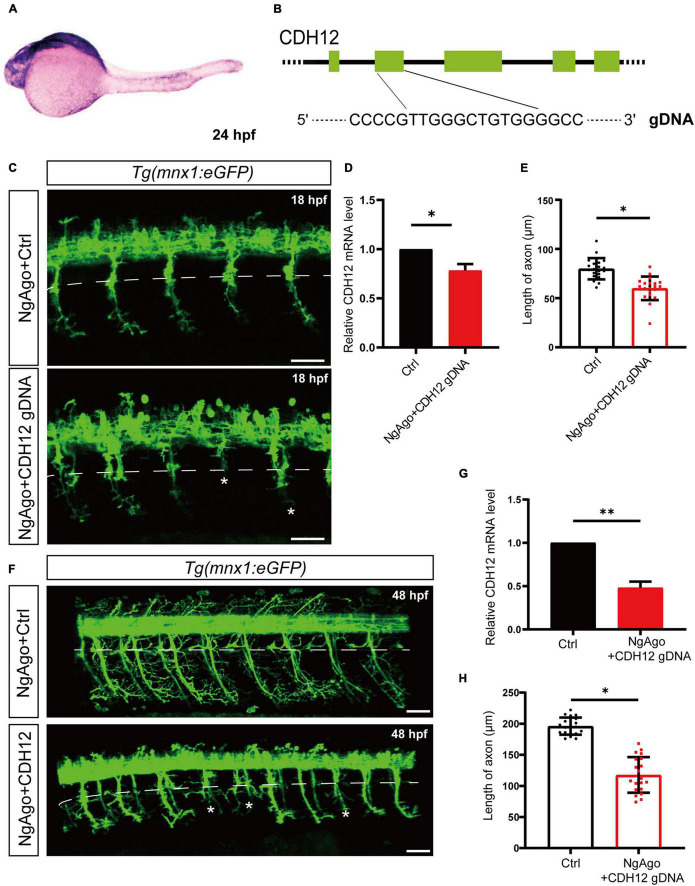
FIGURE 5
Knockdown of CDH12 shortens the length of axons in zebrafish caudal primary (Cap) neurons. (A) In situ hybridization showing the expression patterns of CDH12 in zebrafish embryos at 24 hpf. CDH12 expression is mainly observed in the hindbrain and the spinal cord. (B) Schematic diagram of CDH12 gDNA-induced NgAgo knockdown. (C) Fluorescence images of Cap neurons after NgAgo-mediated CDH12 knockdown for 18 h. White dotted lines indicate the body parts of zebrafish Cap neurons, and a “∗” represents the absence of axons. The scale bar represents 50 μm. (D) The efficiency of CDH12 NgAgo treatment as determined via the qRT-PCR assay. The data are presented as the mean ± SE, n = 3, ∗P < 0.05. (E) Statistical results of the axon length of Cap neurons after CDH12 knockdown in zebrafish embryos for 12 h. The data are presented as the mean ± SE, n = 20, ∗P < 0.05. (F) Fluorescence images of NgAgo-mediated CDH12 knockdown in zebrafish (HB9) for 48 h. The scale bar represents 50 μm. (G) The knockdown efficiency carried out by NgAgo treatment was further improved. The data are presented as the mean ± SE, n = 3, ∗∗P < 0.01. (H) The extension of axons was similarly inhibited by CDH12 knockdown for 48 h. The data are presented as the mean ± SE, n = 20, ∗P < 0.05.