
|
FIGURE 1
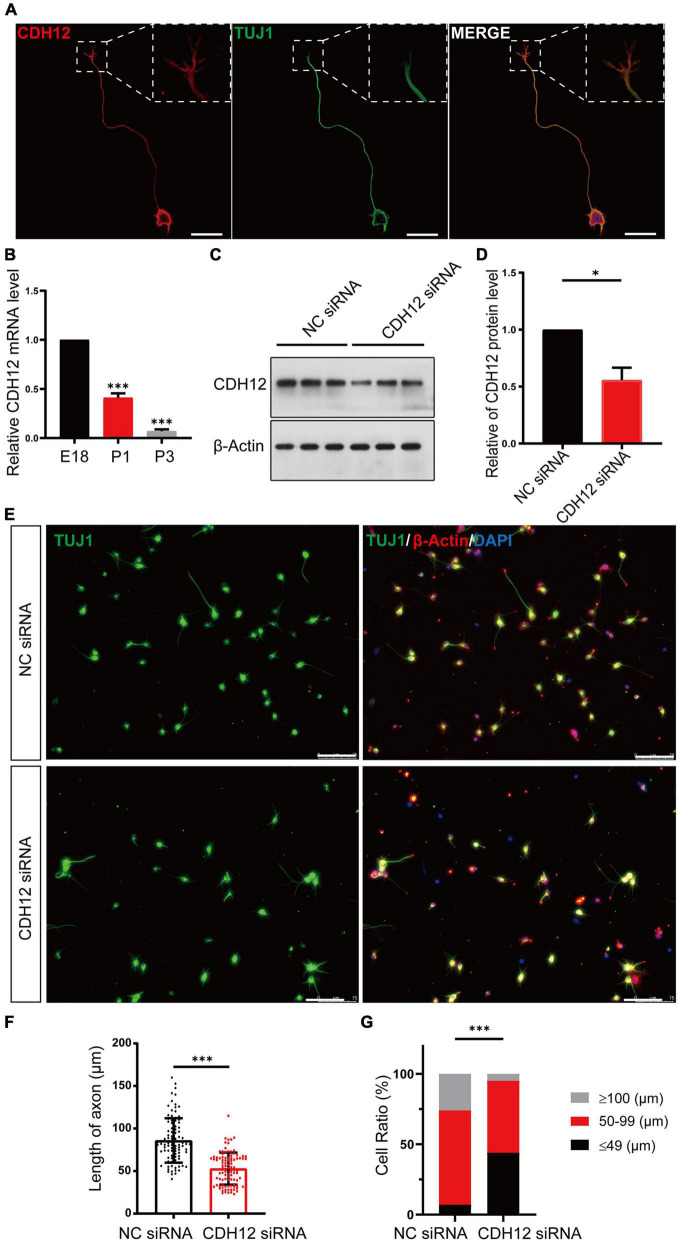
CDH12 knockdown decreased neurite outgrowth in E18 neurons. (A) Representative images of immunofluorescence staining showing the expression of CDH12 in the cell membrane of the cell body, axon, and growth cone. The white dashed box shows an enlarged view of the growth cone. The scale bar represents 25 μm. (B) The mRNA level of CDH12 in cortical neurons decreased gradually with development (E18, P1, P3) as detected using real-time PCR. The level of CDH12 mRNA in E18 neurons was normalized as 1. The data were shown as mean ± SE, n = 3, ∗∗∗P < 0.001. Western blotting (C) and statistical (D) results showing the effectiveness of small interfering RNA in knocking down CDH12 expression. β-actin was used as a loading control. The value of CDH12/β-actin in NC siRNA treatment was normalized as 1. The data were shown as mean ± SE, n = 3, ∗P < 0.05. (E,F) CDH12 knockdown significantly decreased axon growth in E18 neurons after CDH12 siRNA treatment for 36 h. The scale bar represents 75 μm. The data were shown as mean ± SD, n = 96, ∗∗∗P < 0.001. (G) The ratio of neuronal development (with different axonal lengths) was affected by CDH12 knockdown. n = 100, ∗∗∗P < 0.001 (two-way ANOVA).