
Image
|
Figure Caption
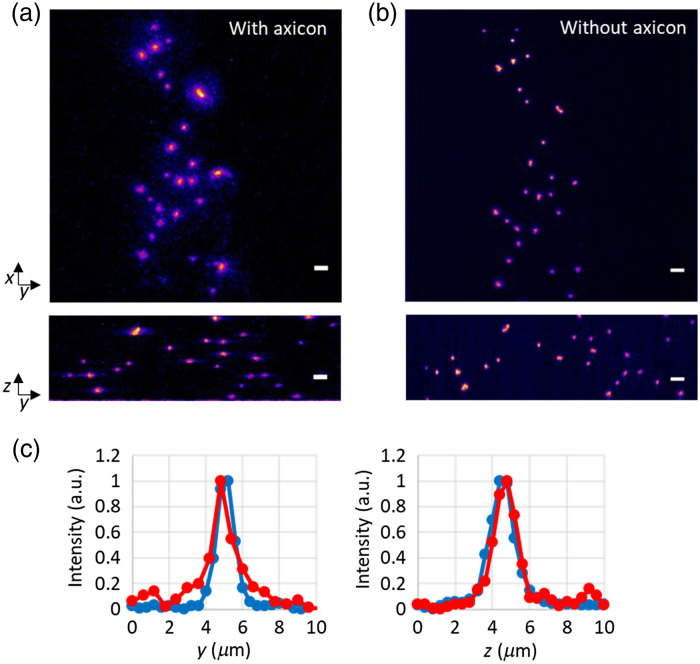
Fig. 2
Imaging fluorescent beads by 2p LSFM (a) with and (b) without axicon imaging. (c) Normalized intensity line profile through a fluorescent bead. Red: with axicon imaging. Blue: without axicon imaging. Scale bars:
Acknowledgments
This image is the copyrighted work of the attributed author or publisher, and
ZFIN has permission only to display this image to its users.
Additional permissions should be obtained from the applicable author or publisher of the image.
Full text @ J. Biomed. Opt.