IMAGE

Figure 5

ID
ZDB-IMAGE-211129-40
Source
Figures for Matsumoto et al., 2021
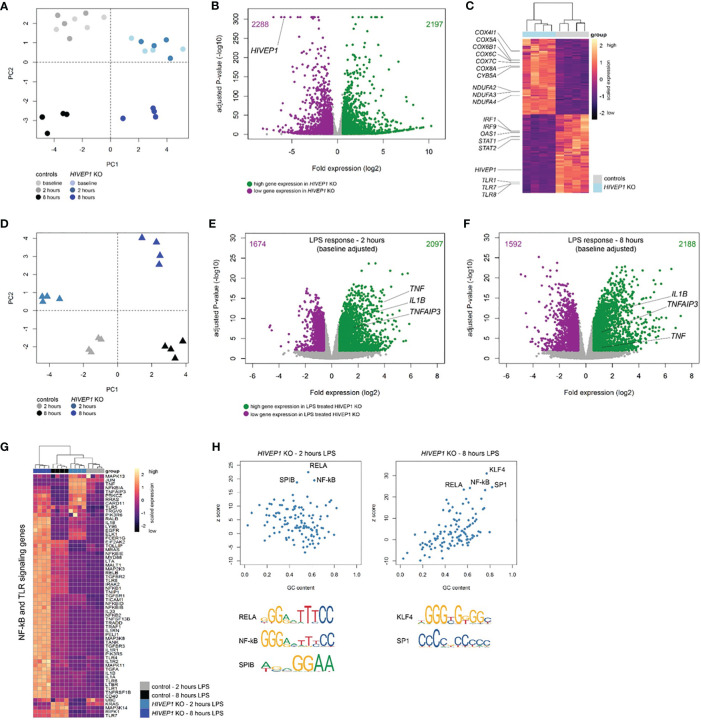
Image
Figure Caption

Figure 5

RNA-sequencing of HIVEP1 deficient THP-1 cells before and after LPS stimulation. (A) Principal component plot of 30,013 genes per sample showing clustering of HIVEP1 deficient cells and controls at baseline and after 2 and 8 hours culturing in medium. (B) Volcano plot depicting genome-wide changes in gene expression of HIVEP1 deficient cells relative to controls at baseline. Green dots denote high expression genes (Benjamini-Hochberg (BH) adjusted p < 0.01 and fold change ≥ 1.5); purple dots depict low expression genes (BH adjusted p < 0.01 and fold change ≤ -1.5). (C) Unsupervised heatmap plot of 4485 significantly altered genes at baseline illustrating genes involved in oxidative phosphorylation, interferon signaling and pattern recognition receptors. (D) Principal component plot (30,013 genes) of LPS-treated (2 and 8 hours) HIVEP1 deficient cells and controls showing clear clustering. (E) Volcano plot depicting genome-wide changes in LPS-induced gene expression (corrected for baseline differences) of HIVEP1 deficient cells relative to controls at 2 hours. (F) Volcano plot illustrating transcriptomic differences in LPS-induced gene expression (baseline corrected) of HIVEP1 deficient cells relative to controls at 8 hours. (G) Heatmap representation of genes involved in Toll-like receptor and NF-kB signaling in LPS-treated samples. (H) Dot plots depicting z-scores against GC content of transcription factor binding site enrichment analysis.

Acknowledgments
This image is the copyrighted work of the attributed author or publisher, and ZFIN has permission only to display this image to its users. Additional permissions should be obtained from the applicable author or publisher of the image. Full text @ Front Immunol