
Image
|
Figure Caption
Figure 1
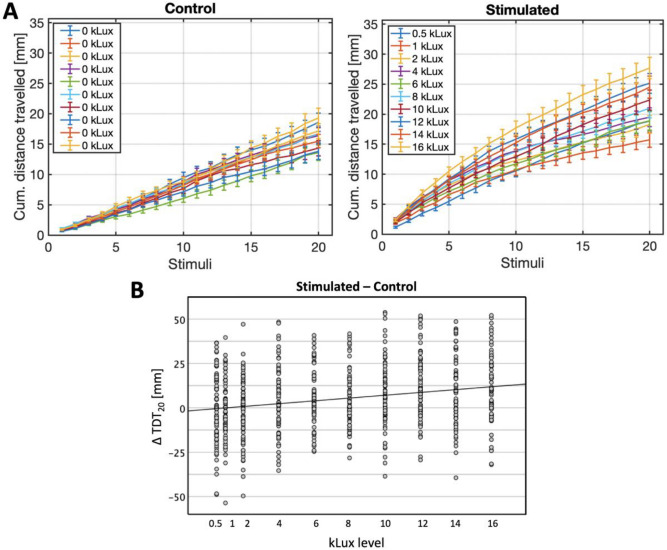
(A) Mean distance travelled (± 1 SE) cumulatively over stimuli, for the stimulated group (right panel) and the respective—with same line colour—control group (left panel), at each kLux level. (B) Mean change in TDT20 (± 1 SE) of the stimulated group relative to the control, at each kLux level (each dot represents a single larva). The predictive model was: Δ TDT20 = − 0.84 + 0.794*(kLux level).
Acknowledgments
This image is the copyrighted work of the attributed author or publisher, and
ZFIN has permission only to display this image to its users.
Additional permissions should be obtained from the applicable author or publisher of the image.
Full text @ Sci. Rep.