
Image
|
Figure Caption
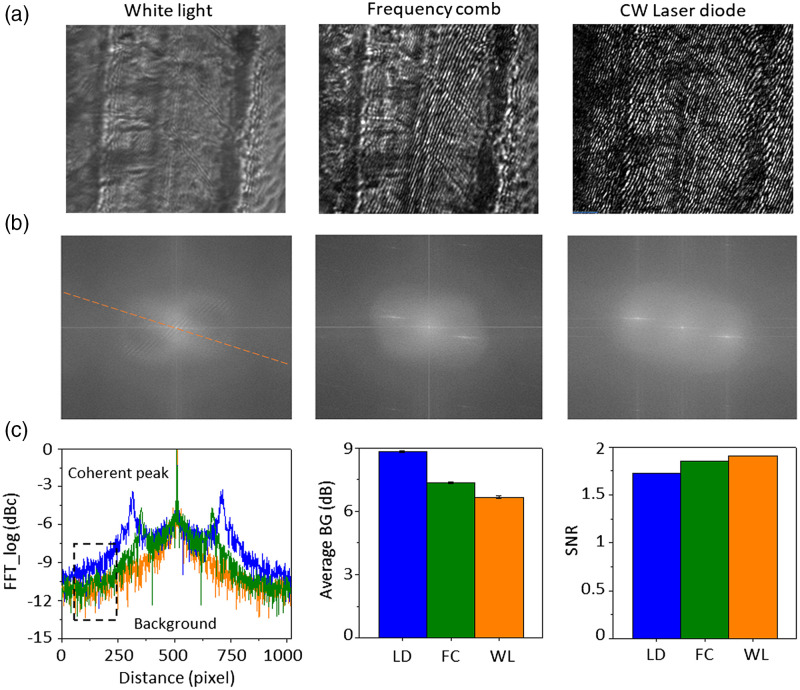
Fig. 2
Evaluation of imaging performance of different light sources in QPI. (a) QPI images of zebrafish trunk illuminated by WL, FC, and continuous-wave LD. (b) FFT spectrums analyzed from the QPI images in (a). (c) Line extraction from the FFT spectrums of three light sources. (d) Average background (BG) noise and SNR, calculated in the Fourier domain.
Acknowledgments
This image is the copyrighted work of the attributed author or publisher, and
ZFIN has permission only to display this image to its users.
Additional permissions should be obtained from the applicable author or publisher of the image.
Full text @ J. Biomed. Opt.