
|
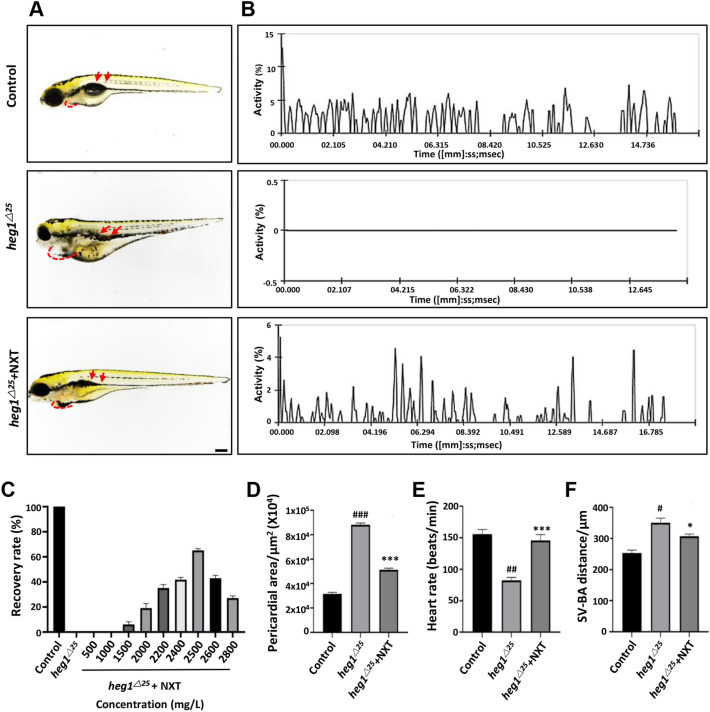
Fig. 5
NXT restored cardiovascular malformation in heg1△25 mutant. A Lateral views of zebrafish embryos at 96 hpf. heg1△25 mutant embryos showing pericardial edema (red dashed line) and venous congestion (red arrows). B Blood flow motion ratios of three groups of zebrafish embryos based on RBCs pixel density changes. C Optimal recovery concentration of NXT. D Pericardial area of the three groups of zebrafish larvae (n = 15 embryos/group). E Heart rates of three groups of zebrafish larvae (n = 15 embryos/group). F SV-BA distance of three groups of zebrafish larvae (n = 15 embryos/group). #p < 0.05, ##p < 0.01, ###p < 0.001 vs control group; *p < 0.05, ***p < 0.001 vs heg1△25 mutant group