
Image
|
Figure Caption
Fig. 4
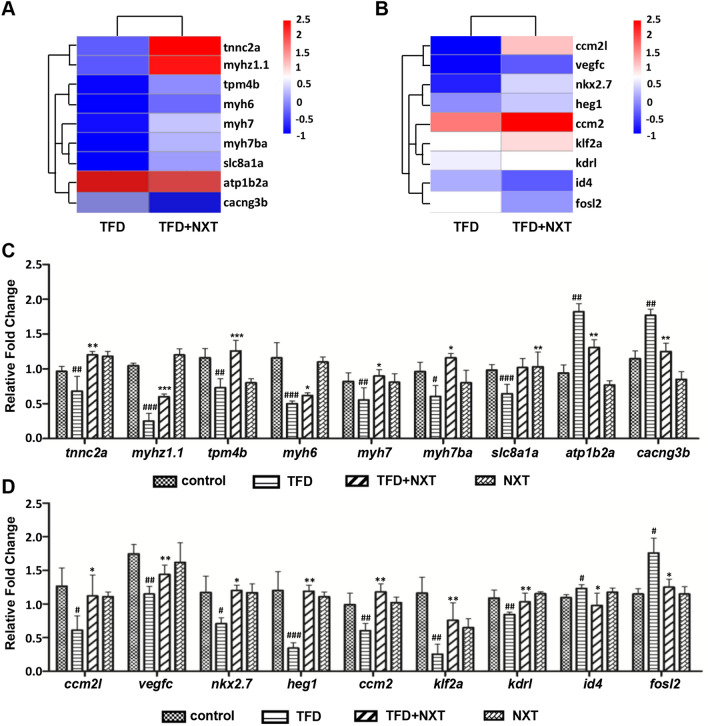
NXT targeting node screening and downstream pathways verification. A myocardium related genes and B cardiovascular development related genes explored by heat map analysis, and verified by qRT-PCR (C, D). Data are represented as mean ± SD. #p < 0.05, ##p < 0.01, ###p < 0.001 vs control group; *p < 0.05, **p < 0.01, ***p < 0.001 vs TFD-induced group
Acknowledgments
This image is the copyrighted work of the attributed author or publisher, and
ZFIN has permission only to display this image to its users.
Additional permissions should be obtained from the applicable author or publisher of the image.
Full text @ Chin. Med.