
Image
|
Figure Caption
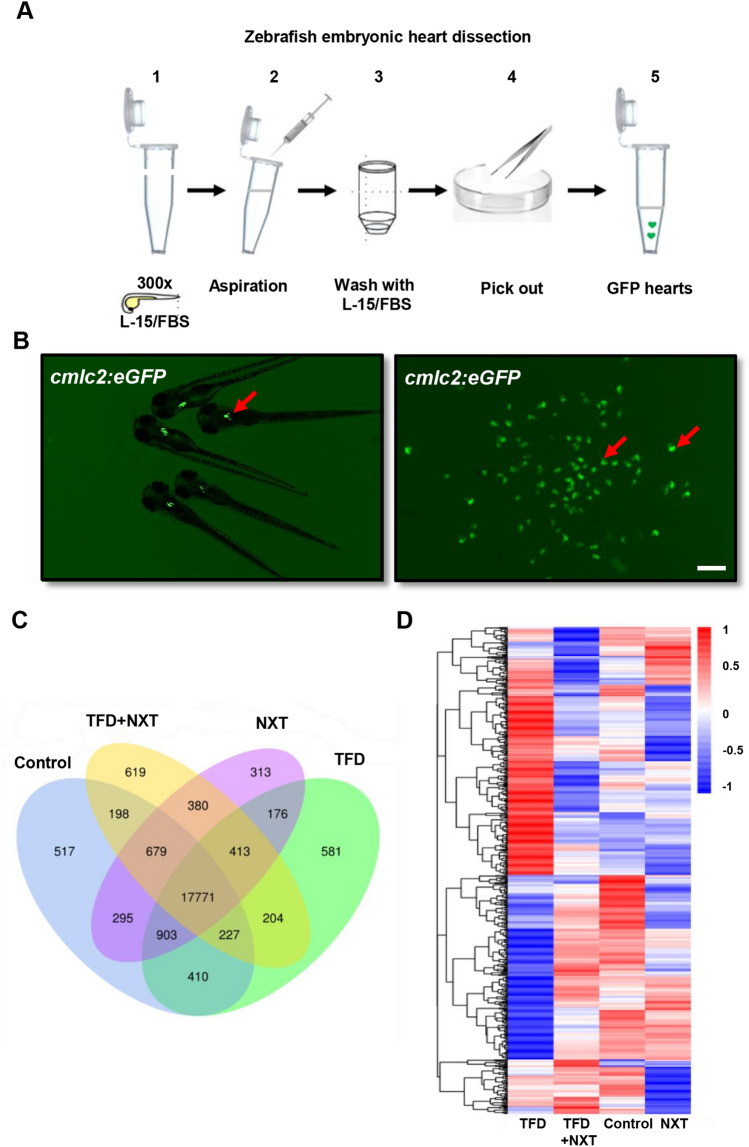
Fig. 2
Transcriptome analysis of differentially expressed genes in NXT treated cardiomyopathy zebrafish hearts. A A schematic overview of heart isolation in zebrafish embryos. B The isolated cardiac tissues from Tg(cmlc2:eGFP) transgenic fish embryos at 96 hpf. C Venn diagram analysis and D Heat map representation showing DGEs in control, TFD, TFD + NXT and NXT group
Acknowledgments
This image is the copyrighted work of the attributed author or publisher, and
ZFIN has permission only to display this image to its users.
Additional permissions should be obtained from the applicable author or publisher of the image.
Full text @ Chin. Med.