
IMAGE
Figure 3
- ID
- ZDB-IMAGE-211120-16
- Publication
- Rodríguez-Ortiz et al., 2021 - Mutants of the Zebrafish K+ Channel Hcn2b Exhibit Epileptic-like Behaviors
- All Figures
- Figures for Rodríguez-Ortiz et al., 2021
Image
|
Figure Caption
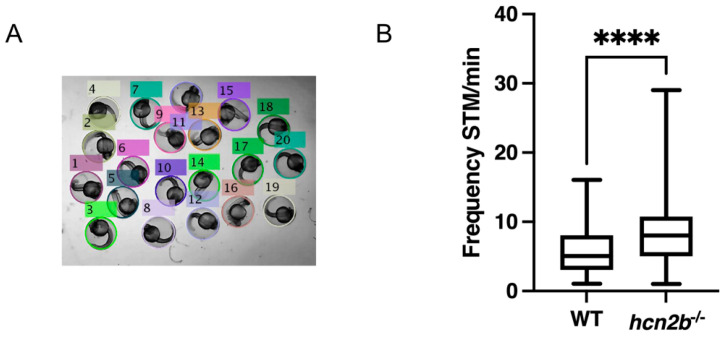
Figure 3
Spontaneous tail movement. (A) Twenty-four hours post-fertilization zebrafish larvae in a glass slide; tagged and numbered by MATLAB application ZebraSTM [27]. (B) Frequency of spontaneous tail movements (STM) per one minute of WT versus hcn2b−/− zebrafish mutant. Homozygous hcn2b mutants showed 1.5 times more tail movements compared to WT. Asterisk indicate statistical significance compared to the control, p < 0.0001 (****).
Figure Data
Acknowledgments
This image is the copyrighted work of the attributed author or publisher, and
ZFIN has permission only to display this image to its users.
Additional permissions should be obtained from the applicable author or publisher of the image.
Full text @ Int. J. Mol. Sci.