
|
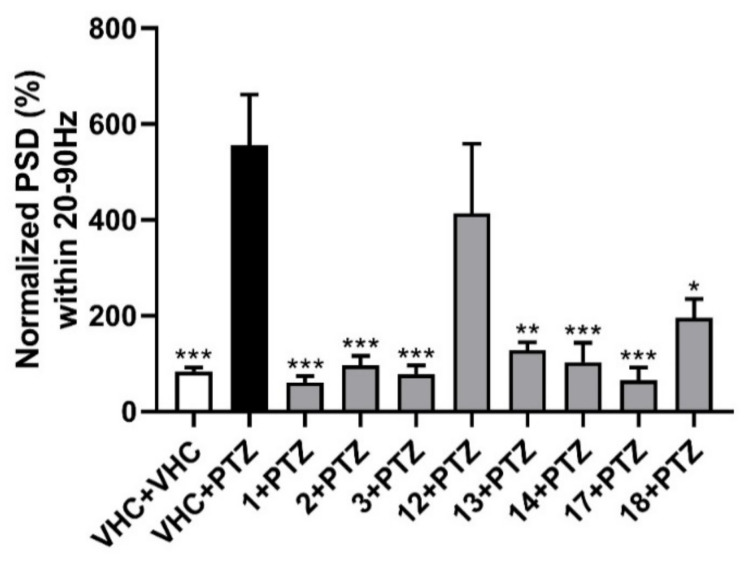
Figure 3
Electrophysiological antiseizure analysis of coumarins used in this study. Non-invasive local field potential recordings from the optic tectum of larvae pre-exposed to vehicle (VHC) only, VHC and pentylenetetrazole (PTZ), or test compound and PTZ. Normalized power spectral density (PSD) in defined frequency band of 20–90 Hz per individual larva is shown (mean ± SEM). Number of replicates: n = 9–10 for each compound group and n = 29–30 for the VHC + VHC and VHC + PTZ controls. Statistical analysis: one-way ANOVA with Dunnett’s multiple comparisons test (GraphPad Prism 7). Significance levels: * p < 0.05; ** p < 0.01; *** p < 0.001.