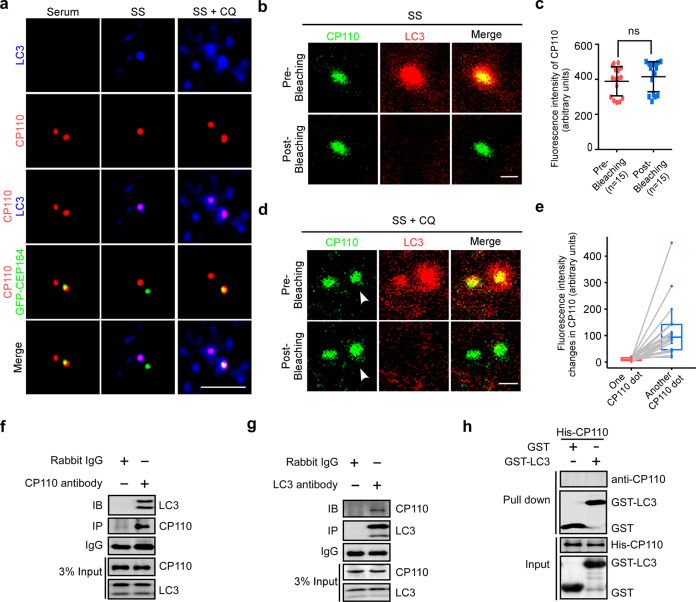
Fig. 2
a MEF cells transfected with GFP-CEP164 were cultured with or without serum for 24 h, treated with or without 20 μM CQ, and processed for immunostaining analysis with anti-CP110 and anti-LC3 antibodies. Scale bar, 2 µm. b–e MEF cells were starved for 24 h, treated with or without 20 μM CQ, stained with anti-CP110 and anti-LC3 antibodies, and subjected to FRET analysis by acceptor photobleaching. The LC3 dots were photobleached. Representative images of FRET experiments are shown (b, d). The dots with FRET-positive signals are labeled by white arrowheads. Scale bar, 0.5 µm. CP110 fluorescence intensities at daughter centrioles before (pre-) and after (post-) photobleaching are shown in starved cells (c). The quantification of changes in the CP110 fluorescence intensity at centrioles of starved cells with CQ treatment after photobleaching is presented (e). f, g MEF cells cultured with serum were processed for co-IP analysis with anti-CP110 (f) or anti-LC3 (g) antibodies. h In vitro interaction of purified GST-LC3 with His-CP110. Quantitative data are expressed as the means ± SD (at least three independent experiments). n, sample size. ns, not significant (P > 0.05); Student’s t-test.

