
Figure 8
- ID
- ZDB-IMAGE-211118-81
- Publication
- Schlegel et al., 2021 - Disturbed retinoid metabolism upon loss of rlbp1a impairs cone function and leads to subretinal lipid deposits and photoreceptor degeneration in the zebrafish retina
- All Figures
- Figures for Schlegel et al., 2021
|
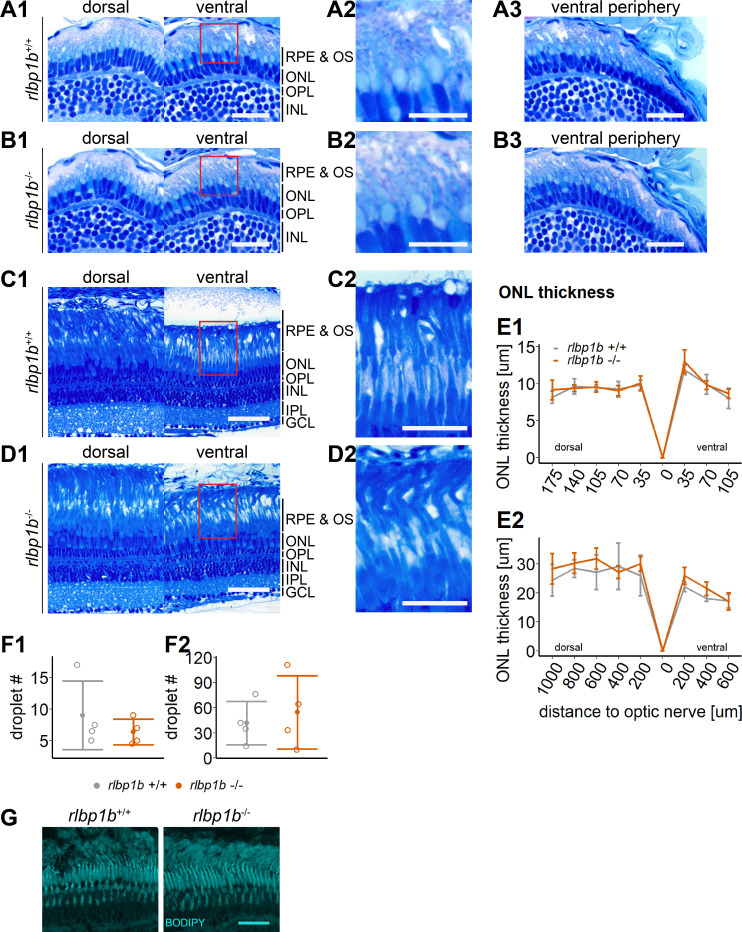
Figure 8
(A1–D1) Central retinal semithin plastic sections (dorsal and ventral of the optic nerve) of rlbp1b+/+ and rlbp1b−/− 5 days postfertilization (dpf) larvae (A, B), and adults (C, D). (A2–D2) Closeup of area in red box. (A3, B3) Ventral peripheral retina. (E) Quantification of outer nuclear layer (ONL) thickness in 5 dpf (E1) and adult (E2) retinas. Data are from n ≥ 3 biological replicates per genotype and age. Shown is the mean ± standard deviation (SD) at specified distances from the optic nerve in central retinal sections (dorsal and ventral). Effect of genotype on ONL thickness (repeated-measures analysis of variance [ANOVA]) at 5 dpf (E1) [F(1,8) = 0.881, p = 0.38] and in adults (E2) [F(1,6) = 1.278, p = 0.30]. (F) Quantification of the number of lipid droplets throughout a central retinal section in 5 dpf (F1) and adult (F2) retinas. Comparison of rlbp1b−/− vs. rlbp1b+/+ was performed using t-test: (F1) [t(3.84) = 0.904, p = 0.42] and (F2) [t(4.86) = −0.503, p = 0.64]. Individual data points (open circles) from n ≥ 3 biological replicates are shown per genotype and age with mean ± standard deviation (SD). (G) Staining for neutral lipids with BODIPY TR methyl ester reveals a healthy adult retina in both rlbp1b+/+ and rlbp1b−/−. Scale bars: (A1, A3, B1, B3) 20 μm, (A2, B2) 10 μm, (C1, D1) 50 μm, (C2, D2) 25 μm, and (G) 10 μm. See Figure 8—source data 1 for measurements in E and F.
Normal retinal morphology and no accumulation of subretinal lipids in rlbp1b-knockout (KO).