
Figure 4
- ID
- ZDB-IMAGE-211111-52
- Publication
- Ghanta et al., 2021 - 5' modifications improve potency and efficacy of DNA donors for precision genome editing
- All Figures
- Figures for Ghanta et al., 2021
|
Figure 4
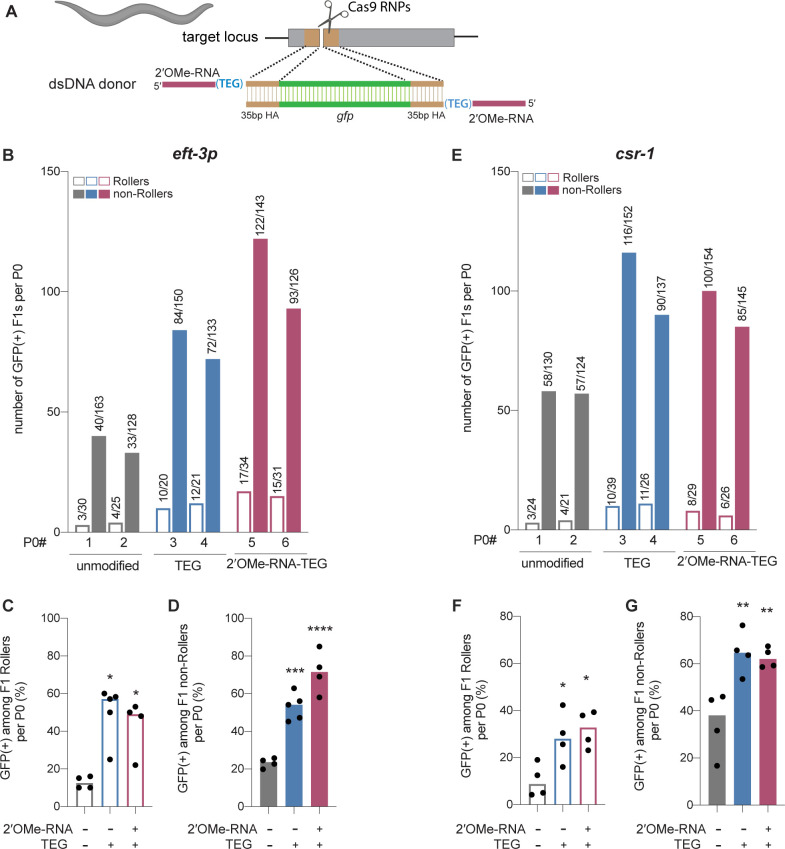
(A) Schematic showing end-modified double-stranded DNA (dsDNA) donors (25 ng/µl) with short (~35 bp) homology arms to insert gfp tag. (B) Number of green fluorescent protein (GFP) expressing animals among entire F1 brood of two representative P0 animals for each donor type are plotted for eft-3p reporter locus. Fraction of F1 animals expressing GFP among (C) Roller and (D) non-Roller cohorts are plotted as percentage for eft-3p locus. Similarly, (E) number of GFP expressing animals among two representative broods, fraction of F1 animals expressing GFP among (F) Roller and (G) non-Roller cohorts are plotted for csr-1 locus. Open bars (Rollers) and closed bars represent (non-Rollers) median. Number of GFP expressing animals among total number of animals scored per cohort are shown above the bars. n ≥ 4 broods for each donor condition. p-Values were calculated using one-way ANOVA and in all cases end-modified donors were compared to unmodified donors (Tukey’s multiple comparisons test; ****p < 0.0001; ***p < 0.001; **p < 0.01; *p < 0.05; ns, not significant).
Modified donors promote precise editing in Caenorhabditis elegans.