
Image
|
Figure Caption
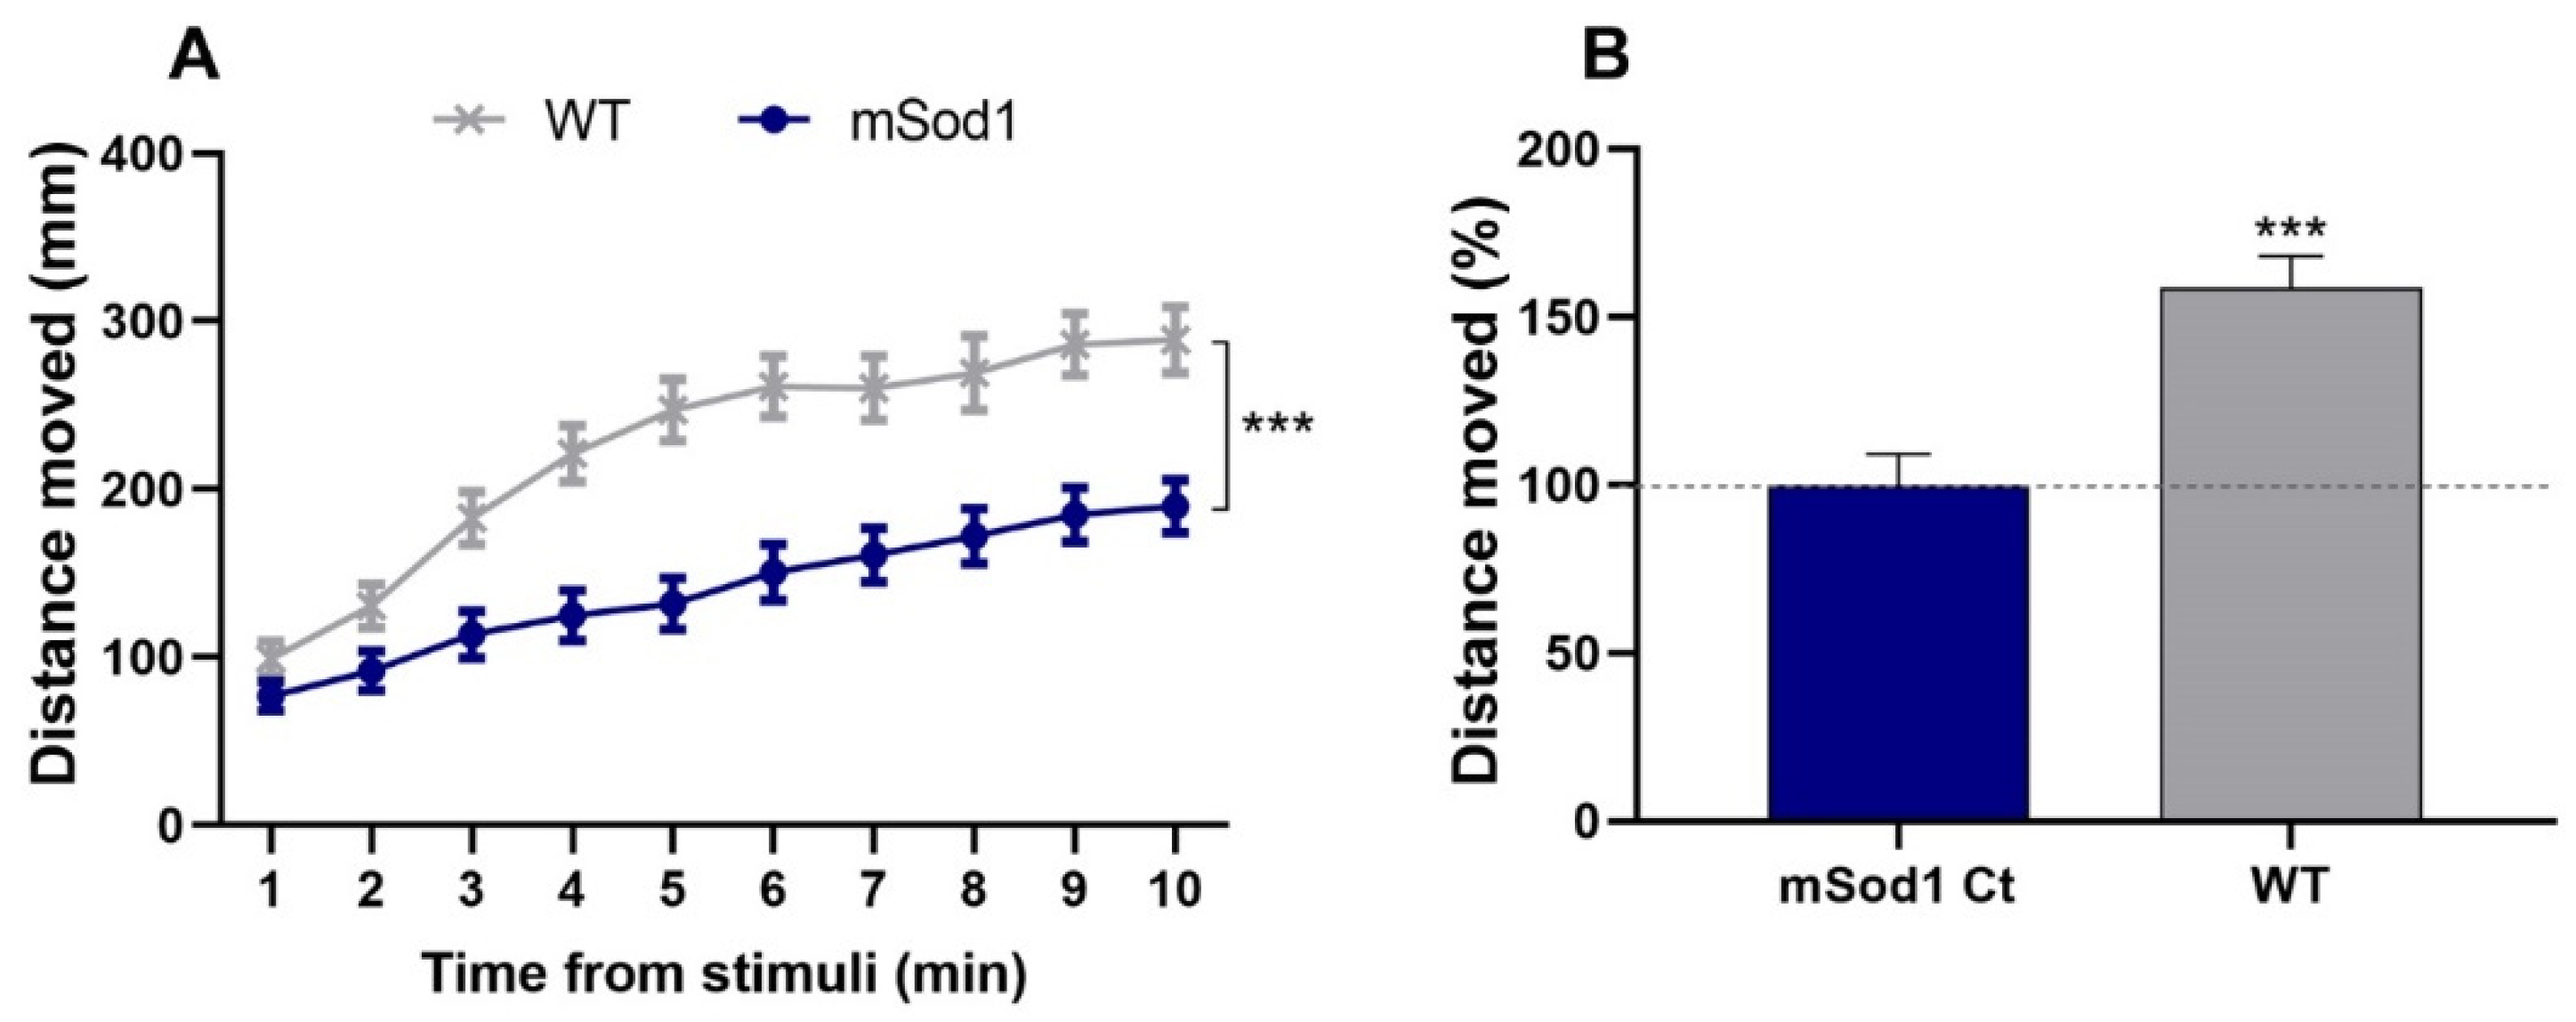
Fig. 1 SOD1 G93R mutant locomotor activity. (A) The distances that 6 dpf WT and mSOD1 larvae swam following light stimuli per 1 min time bin were measured and averaged (*** p < 0.001; linear mixed effect model; n = 48/group). (B) The change (%) in the distance that the WT larvae swam compared to mSod1 larvae. The distances were averaged per fish for the whole 10 min period following light stimuli, scaled per plate and compared between conditions (*** p < 0.001; linear mixed effect model; n = 48/group).
Figure Data
Acknowledgments
This image is the copyrighted work of the attributed author or publisher, and
ZFIN has permission only to display this image to its users.
Additional permissions should be obtained from the applicable author or publisher of the image.
Full text @ Antioxidants (Basel)