
|
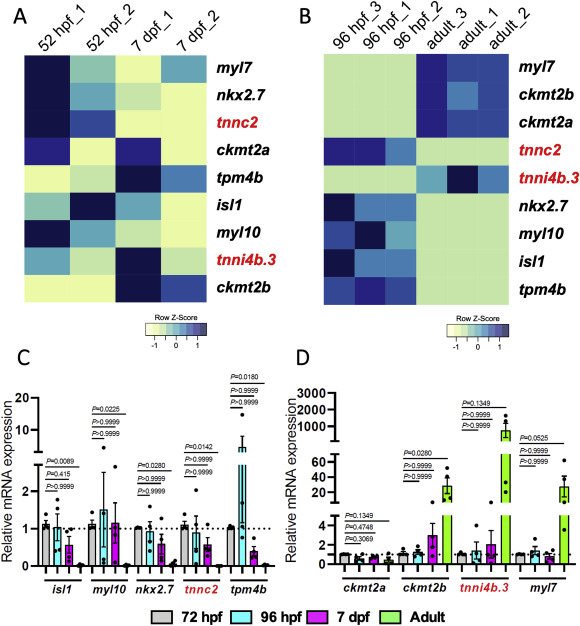
Fig. 1 Transcriptional analysis of developmentally regulated genes in zebrafish hearts. (A) Heatmap of the Row Z-score calculated from average probe intensity from microarray profiling for isl1, myl10, nkx2.7, tnnc2, tpm4b, ckmt2a, ckmt2b, tnni4b.3, and myl7 in embryonic (52 hpf) and larval (7dpf) hearts. (B) Heatmap of the Row Z-score calculated from the normalized reads (RPKM) from RNA-seq for isl1, myl10, nkx2.7, tnnc2, tpm4b, ckmt2a, ckmt2b, tnni4b.3, and myl7 in larval (96 hpf) and adult hearts. (C, D) RT-qPCR analysis of isl1, myl10, nkx2.7, tnnc2, and tpm4b (C) and ckmt2a, ckmt2b, tnni4b.3, and myl7 (D) mRNA levels in extracted hearts from 72 hpf, 96 hpf, 7 dpf, and adult zebrafish (n = 4 per stage). The Ct values can be found in Table S2. P values determined by Kruskal-Wallis test with Dunn’s multiple comparisons test.
Reprinted from Developmental Biology, 476, Tsedeke, A.T., Allanki, S., Gentile, A., Jimenez-Amilburu, V., Rasouli, S.J., Guenther, S., Lai, S.L., Stainier, D.Y.R., Marín-Juez, R., Cardiomyocyte heterogeneity during zebrafish development and regeneration, 259-271, Copyright (2021) with permission from Elsevier. Full text @ Dev. Biol.