
Figure 4
- ID
- ZDB-IMAGE-211103-8
- Publication
- Heylen et al., 2021 - Pericardial Injection of Kainic Acid Induces a Chronic Epileptic State in Larval Zebrafish
- All Figures
- Figures for Heylen et al., 2021
|
Figure 4
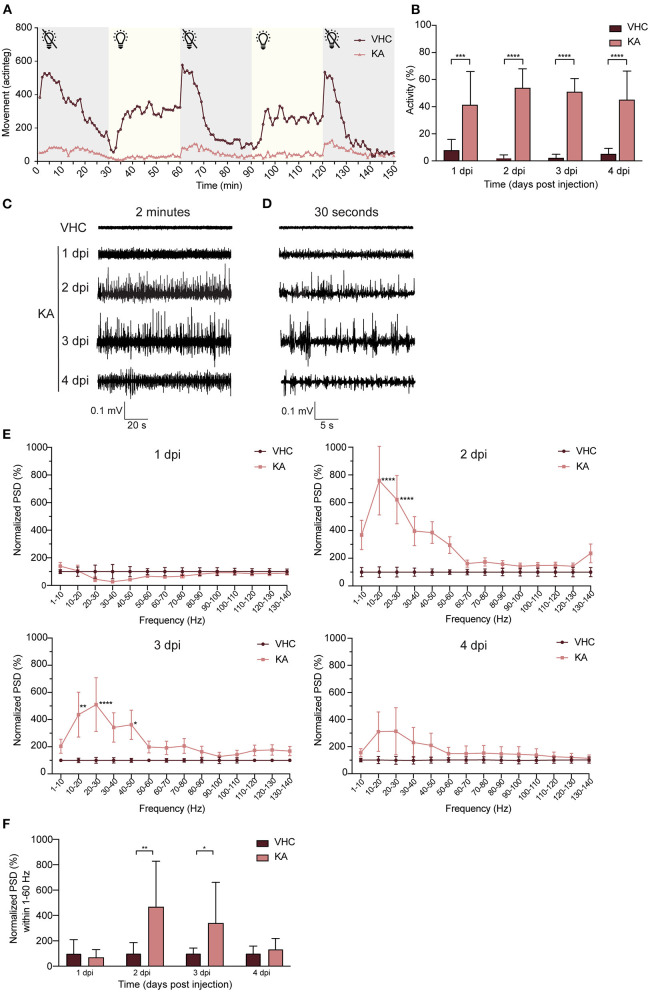
Kainic acid injected larvae display seizure-like behavior and continuous epileptiform discharges as measured by non-invasive local field potential recordings. (A) Decreased locomotor activity of KA-injected larvae at 3 dpi (n = 25) during interchanged dark and light periods of 30 min during 150 min in comparison to VHC-injected controls (n = 18). Error bars were not displayed for the sake of clarity. (B) Analysis of seizure-like behavior of KA-injected larvae at 1–4 dpi in comparison to VHC-injected age-matched controls by quantification of tail twitching. Total number of larvae per condition: 1 dpi VHC n = 10, KA n = 14; 2 dpi VHC n = 11, KA n = 11; 3 dpi VHC n = 14, KA n = 12; 4 dpi VHC n = 10, KA n = 14. At each time point KA-injected larvae displayed statistically significant increase in seizure-like behavior compared to VHC (***p < 0.001, ****p < 0.0001). Data are presented as mean ± s.d. Statistical analysis was performed using unpaired t-test. (C) Two-min representative local field potential (LFP) recordings from VHC- and KA-injected larvae at 1–4 dpi. Note the continuous epileptiform discharges in case of KA-injected larvae at 2–4 dpi. (D) Thirty-s magnification of the corresponding LFP recordings from (C). (E) Power spectral density (PSD) analysis of KA and VHC-injected larvae at 1–4 dpi. No epileptiform brain activity could be observed in KA-injected larvae at 1 dpi, abnormal brain discharges appeared starting from 2 dpi. At 2 dpi and 3 dpi there was a statistically significant increase in PSD values in comparison to VHC-injected larvae. At 4 dpi, PSD values increased as well, however not significant. Results were normalized to VHC-injected larvae as 100%. Total number of larvae per condition: 1 dpi VHC n = 11, KA n = 10; 2 dpi VHC n = 10, KA n = 10; 3 dpi VHC n = 10, KA n = 10; 4 dpi VHC n = 9, KA n = 9. Statistical analysis was performed using two-way Anova with Sidak's multiple comparisons test (*p < 0.05, **p < 0.01, ****p < 0.0001 compared to VHC). (F) Mean PSD values plotted per condition over the 1–60 Hz region for VHC- and KA-injected larvae. Statistically significant increases in mean PSD values compared to VHC were observed for 2 dpi (**p < 0.01) and 3 dpi (*p < 0.05). Data are presented as mean ± s.d. Statistical analysis was performed using unpaired t-test.